Writing

Wordle me this, Batman

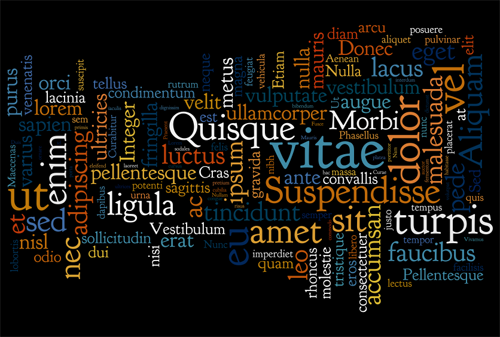
I’ve never really been fond of tag clouds, but Wordle, by MacGyver of software (and former drummer for They Might Be Giants) Jonathan Feinberg gives the representation an aesthetic nudge lacking in most representations. The application creates word clouds from input data submitted by users. I was reminded of it yesterday by Eugene, who submitted Lorem Ipsum:

lorem-500.png

I had first heard about it from emailer Bill Robertson, who had uploaded Organic Information Design, my master’s thesis. (Which was initially flattering but quickly became terrifying when I remembered that it still badly needs a cleanup edit.)

organic-500.jpg

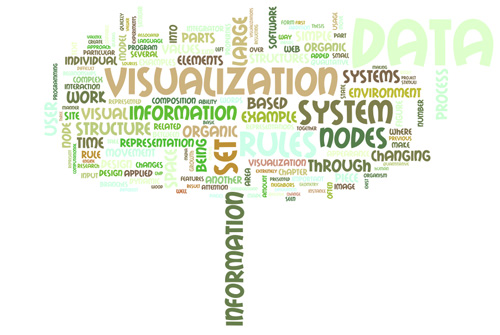
A wonderful tree shape! Can’t decide which I like better: “information” as the stem or “data” as a cancerous growth in the upper-right.

Mr. Feinberg is also the reason that Processing development has been moving to Eclipse (replacing emacs, some shell scripts, two packages of bazooka bubble gum and the command line) because of his donation of a long afternoon helping set up the software in the IDE back when I lived in East Cambridge, just a few blocks from where he works at IBM Research.

Wednesday, July 23, 2008 | inbox, refine, represent  
Book

Visualizing Data Book CoverVisualizing Data is my 2007 book about computational information design. It covers the path from raw data to how we understand it, detailing how to begin with a set of numbers and produce images or software that lets you view and interact with information. When first published, it was the only book(s) for people who wanted to learn how to actually build a data visualization in code.

The text was published by O’Reilly in December 2007 and can be found at Amazon and elsewhere. Amazon also has an edition for the Kindle, for people who aren’t into the dead tree thing. (Proceeds from Amazon links found on this page are used to pay my web hosting bill.)

Examples for the book can be found here.

The book covers ideas found in my Ph.D. dissertation, which is the basis for Chapter 1. The next chapter is an extremely brief introduction to Processing, which is used for the examples. Next is (chapter 3) is a simple mapping project to place data points on a map of the United States. Of course, the idea is not that lots of people want to visualize data for each of 50 states. Instead, it’s a jumping off point for learning how to lay out data spatially.

The chapters that follow cover six more projects, such as salary vs. performance (Chapter 5), zipdecode (Chapter 6), followed by more advanced topics dealing with trees, treemaps, hierarchies, and recursion (Chapter 7), plus graphs and networks (Chapter 8).

This site is used for follow-up code and writing about related topics.