Writing

GMing the Inbox

An email regarding the last post, answering some of the questions about success and popularity of management games. Andrew Walkingshaw writes:

The short answer to this is “yes” – football (soccer) management games are a very big deal here in Europe. One of the major developers is Sports Interactive, (or at Wikipedia) with their Championship Manager/Football Manager series: they’ve been going over fifteen years now.

And apparently the games have even been popular since the early 80s. I found this bit especially interesting:

Fantasy soccer doesn’t really work – the game can’t really be quantified in the way NFL football or baseball can – so it could be that these games’ popularity comes from filling the same niche as rotisserie baseball does on your side of the Atlantic.

Which suggests a more universal draw to the numbers game or statistics competition that gives rise to fantasy/rotisserie leagues. The association with sports teams gives it broader appeal, but at its most basic, it’s just sports as a random number generator.

938624_20070406_screen002_500px.jpg

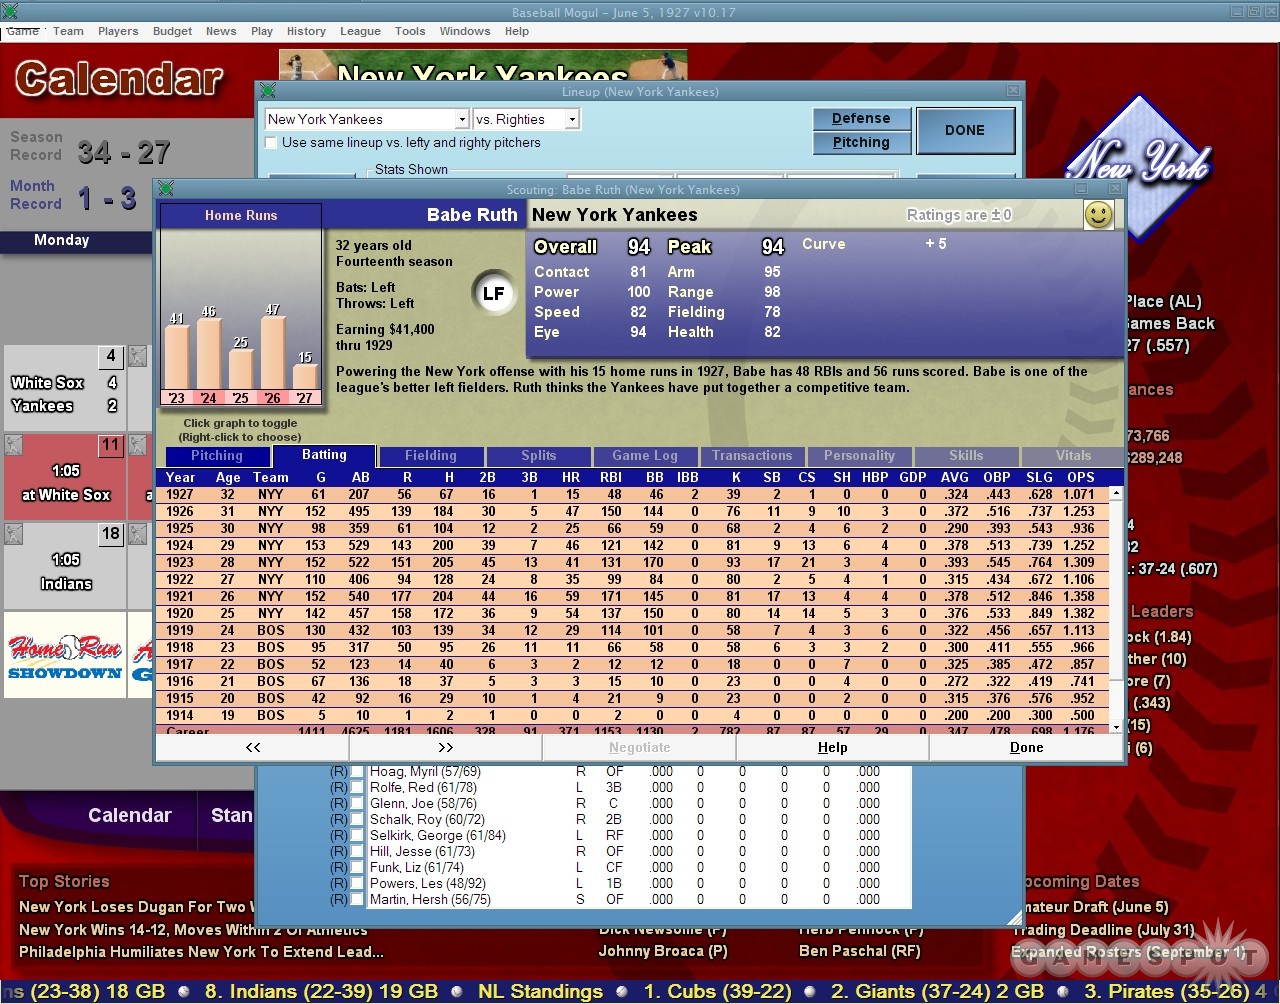
Some further digging yesterday also turned up Baseball Mogul 2008 (and the 2009 Edition). The interface seems closer to a bad financial services app (bad in this case just means poorly designed, click the image above for a screenshot), which is the opposite direction of what I’m interested in, but at least gives us another example. Although this one also seems to have reviewed better than the game from the previous post.

Saturday, January 24, 2009 | baseball, feedbag, games, simulation, sports  
Book

Visualizing Data Book CoverVisualizing Data is my 2007 book about computational information design. It covers the path from raw data to how we understand it, detailing how to begin with a set of numbers and produce images or software that lets you view and interact with information. When first published, it was the only book(s) for people who wanted to learn how to actually build a data visualization in code.

The text was published by O’Reilly in December 2007 and can be found at Amazon and elsewhere. Amazon also has an edition for the Kindle, for people who aren’t into the dead tree thing. (Proceeds from Amazon links found on this page are used to pay my web hosting bill.)

Examples for the book can be found here.

The book covers ideas found in my Ph.D. dissertation, which is the basis for Chapter 1. The next chapter is an extremely brief introduction to Processing, which is used for the examples. Next is (chapter 3) is a simple mapping project to place data points on a map of the United States. Of course, the idea is not that lots of people want to visualize data for each of 50 states. Instead, it’s a jumping off point for learning how to lay out data spatially.

The chapters that follow cover six more projects, such as salary vs. performance (Chapter 5), zipdecode (Chapter 6), followed by more advanced topics dealing with trees, treemaps, hierarchies, and recursion (Chapter 7), plus graphs and networks (Chapter 8).

This site is used for follow-up code and writing about related topics.