
F* Everything, We’re Doing 44 Vertebrates
From an announcement email sent this week by the folks behind the UCSC Genome Browser project:
We are pleased to announce the release of a new Conservation track based on the human (hg18) assembly. This track shows multiple alignments of 44 vertebrate species and measurements of evolutionary conservation using two methods (phastCons and phyloP) from the PHAST package, for all species (vertebrate) and two subsets (primate and placental mammal). The multiple alignments were generated using multiz and other tools in the UCSC/Penn State Bioinformatics comparative genomics alignment pipeline. Conserved elements identified by phastCons are also displayed in this track. For more details, please visit the track description page…
It’s the comparative genomics equivalent of “Fuck Everything, We’re Doing Five Blades,” an editorial penned by James M. Kilts (President and CEO of Gillette) for The Onion. Kilts writes:
Would someone tell me how this happened? We were the fucking vanguard of shaving in this country. The Gillette Mach3 was the razor to own. Then the other guy came out with a three-blade razor. Were we scared? Hell, no. Because we hit back with a little thing called the Mach3Turbo. That’s three blades and an aloe strip. For moisture. But you know what happened next? Shut up, I’m telling you what happened—the bastards went to four blades. Now we’re standing around … selling three blades and a strip. Moisture or no, suddenly we’re the chumps. Well, fuck it. We’re going to five blades.
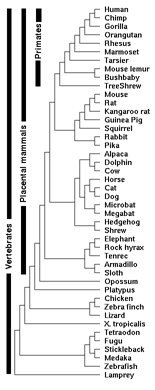 Conservation tracks in the human genome are simply additional lines of annotation shown alongside the human DNA sequence. The lines show identical areas of near-similar DNA found in other species (in this case 44 vertebrates). In the past we might have looked at two, three, seven, maybe a dozen different species in a row. UCSC had actually been up to 27 different species at a time before they took the extra push over the cliff to 44.
As it turns out, just sequencing the human genome isn’t all that interesting. It only starts to get interesting in the context of other genomes from other species. With multiple species, the data can be compared and evolutionary trees drawn. We can take an organism that we know a lot about — say the fruitfly — and compare its genes (which have been studied extensively) to the genetic code of humans (who have been studied less), and we can look for similar regions. For instance, the HOX family of genes is involved in structure and limb development. A similar region can be found in humans, insects, and many things in between. How cool is that?
Further, how about all that “junk” DNA? A particular portion of DNA might have no known function, but if you find an area where the data matches (is conserved) with another species, then it might not be quite as irrelevant as previously thought (and for the record, the term junk is only used in the media). If you see that it’s highly conserved (a large percentage is identical) across many different species, then you’re probably onto something, and it’s time to start digging further.
Spending time with data like this really highlights the silliness of anti-evolution claims. It’s tough to argue with being able to see it. Unfortunately most of the work I’ve done in this area isn’t documented properly, though you can see human/chimp/dog/mouse alignments in this genome browser, a dozen mammals aligned in this illustration, or humans and chimps in this piece.
As an aside, a few months after the Onion article, Gillette really did go to five blades with their Fusion razor. And happily, the (real) CEO speaks with the same bravado as the earlier editorial:
“The Schick launch has nothing to do with this, it’s like comparing a Ferrari to a Volkswagen as far as we’re concerned,” Chairman, President and Chief Executive James Kilts, told Reuters.
And why isn’t that guy doing their ads instead of those other namby-pambies?
