An email regarding the last post, answering some of the questions about success and popularity of management games. Andrew Walkingshaw writes:
The short answer to this is “yes” – football (soccer) management games are a very big deal here in Europe. One of the major developers is Sports Interactive, (or at Wikipedia) with their Championship Manager/Football Manager series: they’ve been going over fifteen years now.
And apparently the games have even been popular since the early 80s. I found this bit especially interesting:
Fantasy soccer doesn’t really work – the game can’t really be quantified in the way NFL football or baseball can – so it could be that these games’ popularity comes from filling the same niche as rotisserie baseball does on your side of the Atlantic.
Which suggests a more universal draw to the numbers game or statistics competition that gives rise to fantasy/rotisserie leagues. The association with sports teams gives it broader appeal, but at its most basic, it’s just sports as a random number generator.
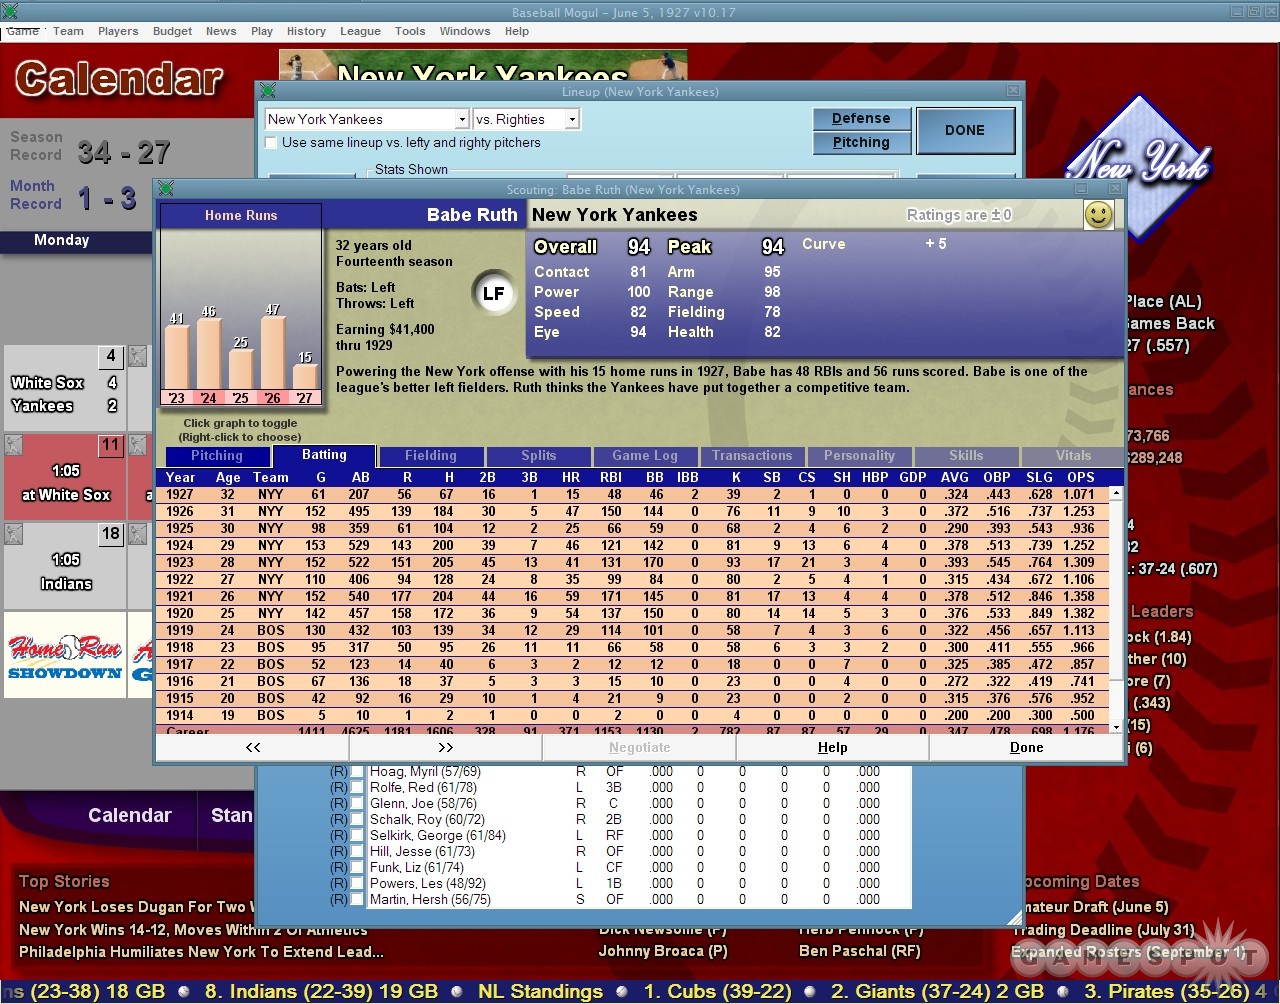
Some further digging yesterday also turned up Baseball Mogul 2008 (and the 2009 Edition). The interface seems closer to a bad financial services app (bad in this case just means poorly designed, click the image above for a screenshot), which is the opposite direction of what I’m interested in, but at least gives us another example. Although this one also seems to have reviewed better than the game from the previous post.
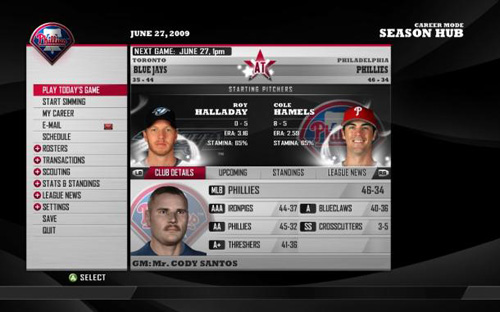
Via News.com, the peculiar story of MLB Front Office Manager, a sports simulation game in which you play the general manager of a major league baseball team. Daniel Terdiman writes:
The new game — which is unlike any baseball video game I’ve ever seen — has perhaps the perfect pitchman, Oakland A’s General Manager Billy Beane. For those not familiar with him, the game probably won’t mean much, since as the main subject of Michael Lewis’ hit book, Moneyball, Beane has long been considered the most cerebral and efficient guy putting contending baseball teams on the field.
This caught my eye because of its focus on the numbers, and how you’d pull that off in the context of a console game.
As you may imagine, FOM’s interface is menu heavy, providing access to the various statistical metrics and trends to keep you apprised as general manager. What is surprising is that FOM manages to bring this depth to the console as well as the PC. While other console-based franchise management titles have struggled to create effective navigation tools, FOB’s vertical menu interface is both clean and intuitive without compromising the depth one would expect from a game in this genre. Top-level categories include submenus (many of which include further submenus) similar to navigating a sports Web site.
Other reviews seem to be less charitable, but I’m less interested in the game itself than the curiosity that it exists in the first place. GameSpot describes the audience:
By 2K’s own admission, the game targets a specific niche: the roughly 3.5 million participants of Fantasy Baseball leagues. It is 2K’s hope that this hardcore baseball audience, many of whom spend two to three hours every day managing their fantasy rosters, will see FOM as a convenient alternative (or even a complement, assuming those individuals forgo sleep).
So it’s a niche, as would be expected. But I’m curious about a handful of issues, a combination of not knowing much about gaming, mixed with a fascination for what gaming means for interfaces:
Could this be done properly, to a point where a game like this is a wider success? The niche audience is interesting at first, but is it possible to take a numbers game to a broader audience than that?
Has anyone already had success doing that?
Are there methods for showing complex numbers, data, and stats that have been used in (particularly console) games that are more effective than typical information dashboards used by, say, corporations?
The combination of having a motivated user who is willing to put up with the numbers suggests that some really interesting things could be done. And because the interface has to be optimized for the limited interaction afforded by a handheld controller (if played on a console) suggests that the implementation would also need to be clever.
If you have any insight, please drop me a line. Or you can continue to speculate for yourself while enjoying the promotional video below with the most fantastically awful background music I’ve heard since Microsoft Songsmith appeared a little while ago.
The take-away from the study, which was presented at the annual meeting of the American Association for the Advancement of Science, was that Mr. Jeter (despite his three Gold Gloves and balletic leaping throws) is the worst-fielding shortstop in the game.
The New York press was unhappy, but the stats-minded baseball types (Sabermetricians) weren’t that impressed. DiMeo continues:
Mostly, though, the paper didn’t provoke much intrigue because Jeter’s badness is already an axiom of [Sabermetric literature]. In fact, debunking the conventional wisdom about the Yankee captain’s fielding prowess has become a standard method of proving the validity of a new fielding statistic. That places Derek Jeter at the frontier of new baseball research.
What I like about the article, aside from a objective and quantitative reason to dislike Jeter (I already have a quantity of subjective reasons) is how the article frames the issue in the broader sports statistics debate. It nicely covers this new piece of information as a microcosm of the struggle between sabermetricians and traditional baseball types, while essentially poking fun at both: the total refusal of the traditional side to buy into the numbers, and the schadenfreude of the geeks going after Jeter since he’s the one who gets the girls. (The article is thankfully not as trite as that, but you get the idea.)
I’m also biased since the metric in the paper places Pokey Reese, one of my favorite Red Sox players of 2004 as #11 amongst second basemen between 2000-2005.
Experts: ‘Derek Jeter Probably Didn’t Need To Jump To Throw That Guy Out’
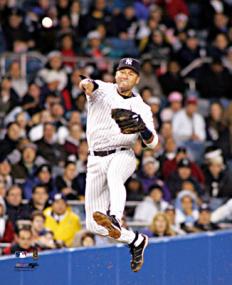
BRISTOL, CT—Baseball experts agreed Sunday that Derek Jeter, who fielded a routine ground ball during a regular-season game in which the Yankees were leading by five runs and then threw it to first base using one of his signature leaps, did not have to do that to record the out. “If it had been a hard-hit grounder in the hole or even a slow dribbler he had to charge, that would’ve been one thing,” analyst John Kruk said during a broadcast of Baseball Tonight. “But when it’s hit right to him by [Devil Rays first-baseman] Greg Norton, a guy who has no stolen bases and is still suffering the effects of a hamstring injury sustained earlier this year… Well, that’s a different story.” Jeter threw out Norton by 15 feet and pumped his fist in celebration at the end of the play.
In other news, I can’t believe I just put a picture of Jeter on my site.
Visualizing Data is my 2007 book about computational information design. It covers the path from raw data to how we understand it, detailing how to begin with a set of numbers and produce images or software that lets you view and interact with information. When first published, it was the only book(s) for people who wanted to learn how to actually build a data visualization in code.
The text was published by O’Reilly in December 2007 and can be found at Amazon and elsewhere. Amazon also has an edition for the Kindle, for people who aren’t into the dead tree thing. (Proceeds from Amazon links found on this page are used to pay my web hosting bill.)
The book covers ideas found in my Ph.D. dissertation, which is the basis for Chapter 1. The next chapter is an extremely brief introduction to Processing, which is used for the examples. Next is (chapter 3) is a simple mapping project to place data points on a map of the United States. Of course, the idea is not that lots of people want to visualize data for each of 50 states. Instead, it’s a jumping off point for learning how to lay out data spatially.
The chapters that follow cover six more projects, such as salary vs. performance (Chapter 5), zipdecode (Chapter 6), followed by more advanced topics dealing with trees, treemaps, hierarchies, and recursion (Chapter 7), plus graphs and networks (Chapter 8).
This site is used for follow-up code and writing about related topics.

 Derek Jeter vs. Objective Reality