Writing

Also from the office of scary flowcharts

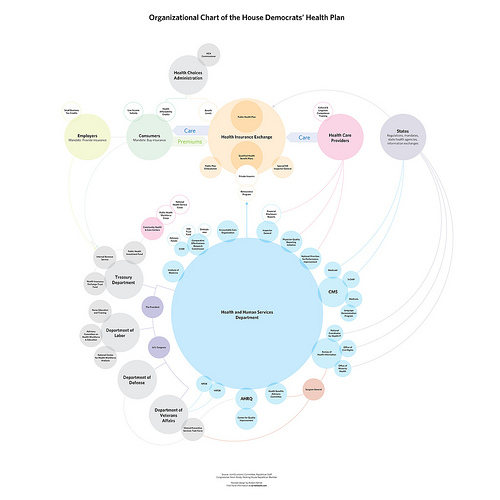
Responding to the Boehner post, Jay Parkinson, M.D. pointed me to this improved chart by designer Robert Palmer, accompanied by an angst-ridden open letter (an ironic contrast to the soft pastels in his diagram) decrying the crimes of visual malfeasance.
gonna have to face it you're addicted to chartsMeanwhile, Ezra Klein over at the Washington Post seems to be thinking along similar lines as my original post, noting this masked artist’s earlier trip to Kinko’s a few weeks ago. Klein writes:

it may be small, but there is still terrorWhoever is heading the Scary Flowcharts Division of John Boehner’s office is quickly becoming my favorite person in Washington. A few weeks ago, we got this terror-inducing visualization of the process behind “Speaker Pelosi’s National Energy Tax.”

That’s hot!

If I were teaching right now, I’d make all my students do a one day charrette on trying to come up with something worse than the Boehner health care image while staying in the realm of colloquial things you can do with PowerPoint. It’d be a great time, and we’d all learn a lot.

Having spent two posts making fun of the whole un-funny mess around health care, I’ll leave you with the best bit of op-ed I’ve read on the topic, from Harold Meyerson, also at the Washington Post:

Watching the centrist Democrats in Congress create more and more reasons why health care can’t be fixed, I’ve been struck by a disquieting thought: Suppose our collective lack of response to Hurricane Katrina wasn’t exceptional but, rather, the new normal in America. Suppose we can no longer address the major challenges confronting the nation. Suppose America is now the world’s leading can’t-do country.

I agree and find it terrifying. And I don’t think that’s a partisan issue.

Now back to your purposefully apolitical, regularly scheduled blog on making pictures of data.

Thursday, August 6, 2009 | feedbag, flowchart, obfuscation, politics, thisneedsfixed  

Mapping Health Care: Here Be Dragons!

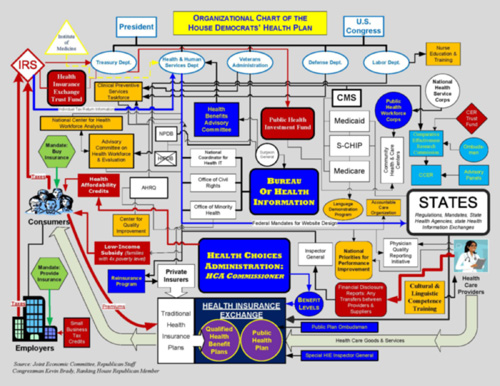
I’m so completely impressed with this incredible bit of info graphic awesomeness distributed by the office of John Boehner, Republican congressman from Ohio’s 8th District. The flow chart purports to show the Democrats’ health care proposal:

keep pushing this health care thing and it's only gonna get uglier!

The image needs to be much larger to be fully appreciated in its magnificent glory of awfulness, so a high resolution version is here, and the PDF version is here.

The chart was used by Boehner as a way to make the plan look as awful as possible — a tactic used to great effect by the same political party during the last attempt at health care reform in 1994. The diagram appears to be the result of a heart-warming collaboration between a colorblind draughtsman, the architect of a nightmarish city water works, and whoever designed the instructions for the bargain shelving unit I bought from Target.

Don’t waste your time, by the way — I’ve already nominated it for an AIGA award.

(And yes, The New Republic also created a cleaner version, and the broader point is that health care is just a complex mess no matter what, so don’t let that get in the way of my enjoyment of this masterwork.)

Additional perspective from The Daily Show (my original source) follows.

Tuesday, August 4, 2009 | flowchart, obfuscation, politics, thisneedsfixed  
Book

Visualizing Data Book CoverVisualizing Data is my 2007 book about computational information design. It covers the path from raw data to how we understand it, detailing how to begin with a set of numbers and produce images or software that lets you view and interact with information. When first published, it was the only book(s) for people who wanted to learn how to actually build a data visualization in code.

The text was published by O’Reilly in December 2007 and can be found at Amazon and elsewhere. Amazon also has an edition for the Kindle, for people who aren’t into the dead tree thing. (Proceeds from Amazon links found on this page are used to pay my web hosting bill.)

Examples for the book can be found here.

The book covers ideas found in my Ph.D. dissertation, which is the basis for Chapter 1. The next chapter is an extremely brief introduction to Processing, which is used for the examples. Next is (chapter 3) is a simple mapping project to place data points on a map of the United States. Of course, the idea is not that lots of people want to visualize data for each of 50 states. Instead, it’s a jumping off point for learning how to lay out data spatially.

The chapters that follow cover six more projects, such as salary vs. performance (Chapter 5), zipdecode (Chapter 6), followed by more advanced topics dealing with trees, treemaps, hierarchies, and recursion (Chapter 7), plus graphs and networks (Chapter 8).

This site is used for follow-up code and writing about related topics.