Just when you thought the world revolved around you
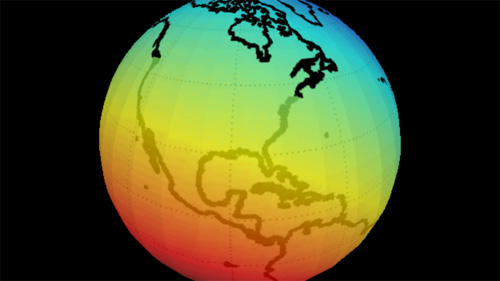
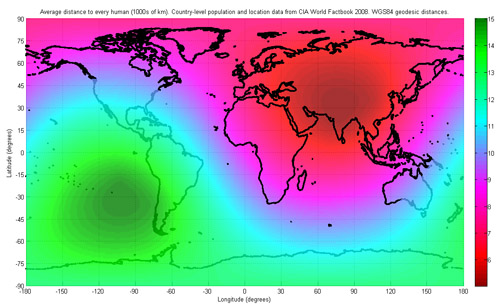
Eugene Kuo sends a link to the Wikipedia article on center of population, an awkward term for the middlin’ place of all the people in a region. Calculation can be tricky because the Earth is round (what!?) and the statistical hooey that goes into determining a proper distance metric. The article includes a heat map of world population:

From a cited article, Wikipedia notes that:
…the world’s center of population is found to lie “at the crossroads between China, India, Pakistan and Tajikistan”, with an average distance of 5,200 kilometers (3,200 mi) to all humans…
Though sadly, the map also uses a strange color scale for the heat map, with blue the area of greatest density, and red (traditionally the “important” end of the scale) as the least populated area. Even shifting the colors helps a bit, at least in terms of highlighting the correct area:
Though the shift is of questionable accuracy, and the bright green still draws too much attention, as does the banding in the middle of the Atlantic.
Outside of musing for your own edification, practical applications of calculating a population’s center include:
…locating possible sites for forward capitals, such as Brasilia, Astana or Austin. Practical selection of a new site for a capital is a complex problem that depends also on population density patterns and transportation networks.
Check the article for more about centers of various countries, including the United States:
The mean center of United States population has been calculated for each U.S. Census since 1790. If the United States map were perfectly balanced on a point, this point would be its physical centroid. Currently this point is located in Phelps County, Missouri, in the east-central part of the state. However, when Washington, D.C. was chosen as the federal capital of the United States in 1790, the center of the U.S. population was in Kent County, Maryland, a mere 47 miles (76 km) east-northeast of the new capital. Over the last two centuries, the mean center of United States population has progressed westward and, since 1930, southwesterly, reflecting population drift.
For added fun, I’ve created an interactive version of the map, based on a Processing example. (Though it took me longer to write the credits for the adaptation than to actually assemble it — thanks for all those who contributed little bits to it.)