The roof of the Metrodome springs a leak following heavy snow in Minnesota:
I’ve been looking at too many particle and fluid dynamics simulations because it looks fake to me — more like a simulation created by the structural engineers of what would happen if the roof were to collapse — rather than thousands of pounds of honest-to-goodness midwestern snow pummeling the turf seemingly in slow motion. Beautiful.
And another version from a local FOX affiliate in Minnesota:
Fascinating editorial from chess champion Gary Kasparov, about the relationship between humans and machines:
The AI crowd, too, was pleased with the result and the attention, but dismayed by the fact that Deep Blue was hardly what their predecessors had imagined decades earlier when they dreamed of creating a machine to defeat the world chess champion. Instead of a computer that thought and played chess like a human, with human creativity and intuition, they got one that played like a machine, systematically evaluating 200 million possible moves on the chess board per second and winning with brute number-crunching force. As Igor Aleksander, a British AI and neural networks pioneer, explained in his 2000 book, How to Build a Mind:
By the mid-1990s the number of people with some experience of using computers was many orders of magnitude greater than in the 1960s. In the Kasparov defeat they recognized that here was a great triumph for programmers, but not one that may compete with the human intelligence that helps us to lead our lives.
It was an impressive achievement, of course, and a human achievement by the members of the IBM team, but Deep Blue was only intelligent the way your programmable alarm clock is intelligent. Not that losing to a $10 million alarm clock made me feel any better.
He continues to describe playing games with humans aided by computers, and how it made the game even more dependent upon creativity:
Having a computer program available during play was as disturbing as it was exciting. And being able to access a database of a few million games meant that we didn’t have to strain our memories nearly as much in the opening, whose possibilities have been thoroughly catalogued over the years. But since we both had equal access to the same database, the advantage still came down to creating a new idea at some point.
Or some of the other effects:
Having a computer partner also meant never having to worry about making a tactical blunder. The computer could project the consequences of each move we considered, pointing out possible outcomes and countermoves we might otherwise have missed. With that taken care of for us, we could concentrate on strategic planning instead of spending so much time on calculations. Human creativity was even more paramount under these conditions. Despite access to the “best of both worlds,” my games with Topalov were far from perfect. We were playing on the clock and had little time to consult with our silicon assistants. Still, the results were notable. A month earlier I had defeated the Bulgarian in a match of “regular” rapid chess 4–0. Our advanced chess match ended in a 3–3 draw. My advantage in calculating tactics had been nullified by the machine.
The final reinforces that I’d heard others describe Kasparov’s play as machine-like in the past (in a sense, this is verification or even quantification of that idea). It also includes some interesting comments on numerical scale:
The number of legal chess positions is 1040, the number of different possible games, 10120. Authors have attempted various ways to convey this immensity, usually based on one of the few fields to regularly employ such exponents, astronomy. In his book Chess Metaphors, Diego Rasskin-Gutman points out that a player looking eight moves ahead is already presented with as many possible games as there are stars in the galaxy. Another staple, a variation of which is also used by Rasskin-Gutman, is to say there are more possible chess games than the number of atoms in the universe. All of these comparisons impress upon the casual observer why brute-force computer calculation can’t solve this ancient board game. They are also handy, and I am not above doing this myself, for impressing people with how complicated chess is, if only in a largely irrelevant mathematical way.
And one last statement:
Our best minds have gone into financial engineering instead of real engineering, with catastrophic results for both sectors.
In the article, Kasparov mentions Moravec’s Paradox, described by Wikipedia as:
“contrary to traditional assumptions, the uniquely human faculty of reason (conscious, intelligent, rational thought) requires very little computation, but that the unconscious sensorimotor skills and instincts that we share with the animals require enormous computational resources”
And another interesting notion:
Marvin Minsky emphasizes that the most difficult human skills to reverse engineer are those that are unconscious. “In general, we’re least aware of what our minds do best,” he writes, and adds “we’re more aware of simple processes that don’t work well than of complex ones that work flawlessly.”
An email regarding the last post, answering some of the questions about success and popularity of management games. Andrew Walkingshaw writes:
The short answer to this is “yes” – football (soccer) management games are a very big deal here in Europe. One of the major developers is Sports Interactive, (or at Wikipedia) with their Championship Manager/Football Manager series: they’ve been going over fifteen years now.
And apparently the games have even been popular since the early 80s. I found this bit especially interesting:
Fantasy soccer doesn’t really work – the game can’t really be quantified in the way NFL football or baseball can – so it could be that these games’ popularity comes from filling the same niche as rotisserie baseball does on your side of the Atlantic.
Which suggests a more universal draw to the numbers game or statistics competition that gives rise to fantasy/rotisserie leagues. The association with sports teams gives it broader appeal, but at its most basic, it’s just sports as a random number generator.
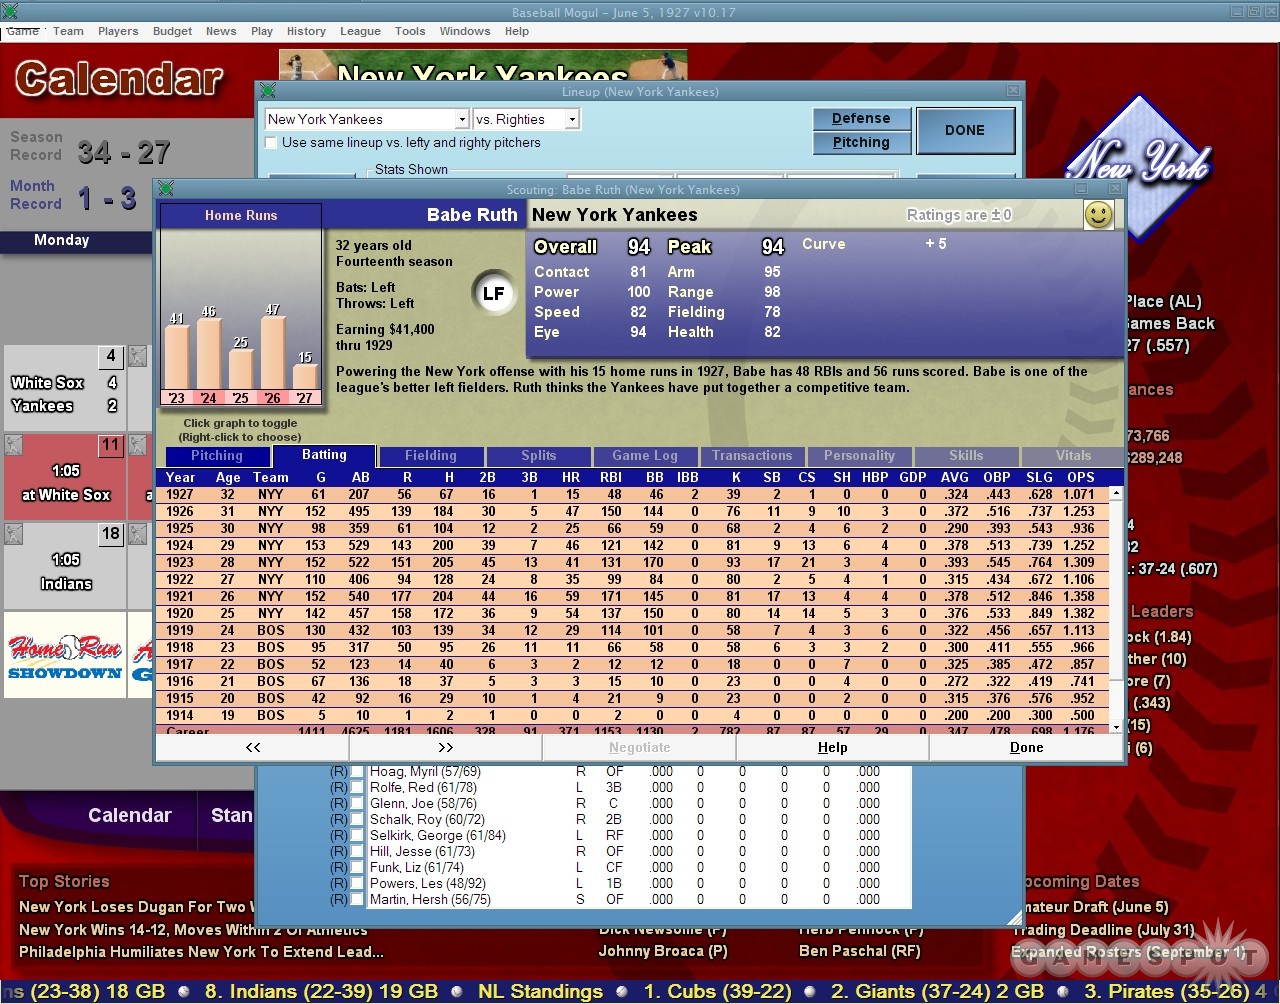
Some further digging yesterday also turned up Baseball Mogul 2008 (and the 2009 Edition). The interface seems closer to a bad financial services app (bad in this case just means poorly designed, click the image above for a screenshot), which is the opposite direction of what I’m interested in, but at least gives us another example. Although this one also seems to have reviewed better than the game from the previous post.
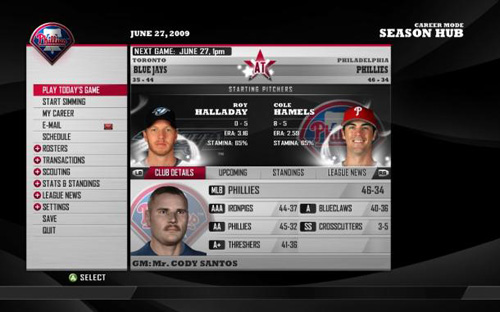
Via News.com, the peculiar story of MLB Front Office Manager, a sports simulation game in which you play the general manager of a major league baseball team. Daniel Terdiman writes:
The new game — which is unlike any baseball video game I’ve ever seen — has perhaps the perfect pitchman, Oakland A’s General Manager Billy Beane. For those not familiar with him, the game probably won’t mean much, since as the main subject of Michael Lewis’ hit book, Moneyball, Beane has long been considered the most cerebral and efficient guy putting contending baseball teams on the field.
This caught my eye because of its focus on the numbers, and how you’d pull that off in the context of a console game.
As you may imagine, FOM’s interface is menu heavy, providing access to the various statistical metrics and trends to keep you apprised as general manager. What is surprising is that FOM manages to bring this depth to the console as well as the PC. While other console-based franchise management titles have struggled to create effective navigation tools, FOB’s vertical menu interface is both clean and intuitive without compromising the depth one would expect from a game in this genre. Top-level categories include submenus (many of which include further submenus) similar to navigating a sports Web site.
Other reviews seem to be less charitable, but I’m less interested in the game itself than the curiosity that it exists in the first place. GameSpot describes the audience:
By 2K’s own admission, the game targets a specific niche: the roughly 3.5 million participants of Fantasy Baseball leagues. It is 2K’s hope that this hardcore baseball audience, many of whom spend two to three hours every day managing their fantasy rosters, will see FOM as a convenient alternative (or even a complement, assuming those individuals forgo sleep).
So it’s a niche, as would be expected. But I’m curious about a handful of issues, a combination of not knowing much about gaming, mixed with a fascination for what gaming means for interfaces:
Could this be done properly, to a point where a game like this is a wider success? The niche audience is interesting at first, but is it possible to take a numbers game to a broader audience than that?
Has anyone already had success doing that?
Are there methods for showing complex numbers, data, and stats that have been used in (particularly console) games that are more effective than typical information dashboards used by, say, corporations?
The combination of having a motivated user who is willing to put up with the numbers suggests that some really interesting things could be done. And because the interface has to be optimized for the limited interaction afforded by a handheld controller (if played on a console) suggests that the implementation would also need to be clever.
If you have any insight, please drop me a line. Or you can continue to speculate for yourself while enjoying the promotional video below with the most fantastically awful background music I’ve heard since Microsoft Songsmith appeared a little while ago.
Visualizing Data is my 2007 book about computational information design. It covers the path from raw data to how we understand it, detailing how to begin with a set of numbers and produce images or software that lets you view and interact with information. When first published, it was the only book(s) for people who wanted to learn how to actually build a data visualization in code.
The text was published by O’Reilly in December 2007 and can be found at Amazon and elsewhere. Amazon also has an edition for the Kindle, for people who aren’t into the dead tree thing. (Proceeds from Amazon links found on this page are used to pay my web hosting bill.)
The book covers ideas found in my Ph.D. dissertation, which is the basis for Chapter 1. The next chapter is an extremely brief introduction to Processing, which is used for the examples. Next is (chapter 3) is a simple mapping project to place data points on a map of the United States. Of course, the idea is not that lots of people want to visualize data for each of 50 states. Instead, it’s a jumping off point for learning how to lay out data spatially.
The chapters that follow cover six more projects, such as salary vs. performance (Chapter 5), zipdecode (Chapter 6), followed by more advanced topics dealing with trees, treemaps, hierarchies, and recursion (Chapter 7), plus graphs and networks (Chapter 8).
This site is used for follow-up code and writing about related topics.