Computational Information Design
1 Introduction
Biology has rapidly become a data-rich science, where the amount of data collected can outpace the speed with which it can be analyzed and subsequently understood. Sequencing projects have made available billions of letters of genetic code, as analysis continues to add layers of annotation that describe known or predicted features along the linear sequence. Ten years ago, a few thousand letters, representing a few hundred genes, were known from a small number of ‘model’ organisms, where today this has become billions of letters representing tens of thousands of genes across a rapidly growing number of organisms.
The quantity of such data makes it extremely difficult to gain a “big picture” understanding of its meaning. The problem is further compounded by the continually changing nature of the data, the result of new information being added, or older information being continuously refined. The amount of data necessitates new software-based tools, and its complexity requires extra consideration be taken in its visual representation in order to highlight features in order of their importance, reveal patterns in the data, and simultaneously show features of the data that exist across multiple dimensions.
One significant difficulty with such problems is knowing, given a set of data, how to glean meaningful information from it. To most, the process is entirely opaque. Fields such as statistics, data mining, graphic design, and information visualization each offer components of the solution, but practitioners of each are often unaware of, or unskilled in, the methods of the adjacent fields required for a solution.
Visual design—the field of mapping data to visual form—aids understanding, but typically does not address how to handle extremely large amounts of data. Data mining techniques can handle large amounts of data, but are disconnected from the means to interact with them. Software-based information visualization adds building blocks for interacting with and representing various kinds of abstract data, but typically the aesthetic principles of visual design are treated as less important or even superficial, rather than embracing their strength as a necessary aid to effective communication. For someone approaching a data representation problem (such as a scientist trying to visualize the results of a study involving a few thousand pieces of genetic data), they will often find it difficult to know where to begin (what tools to use or books to read are frequent questions). Similarly, it is difficult for the same person to critically evaluate the representation used, lacking the necessary background.
In order to properly address the issue of complex data visualization, several fields need to be reconciled as parts of a single process. By combining the necessary skills into a single, clearly documented field, they are made more accessible to those with some partial set of them—graphic designers can learn the computer science necessary for visualization, or statisticians can communicate their data more effectively by understanding the visual design principles behind data representation. The methods themselves are not new, but their isolation to individual fields has prevented them from being used as a whole, since it is rare for someone to obtain the requisite background in each.
This document outlines a process titled Computational Information Design that seeks to bridge the individual disciplines, placing the focus instead on the data and how it is to be considered—rather than from the viewpoint and tools of each individual field.
1.1
data & understanding
This thesis is about the path from data to understanding. The data under consideration might be numbers or lists or relationships between multiple entities. The primary focus is information visualization, where the data is primarily numeric or symbolic rather than physical (i.e. genetic sequence data, where an abstraction of a, c, g, t letters are used to describe a physical structure, and are dominated by layers of annotation that accompany it), as opposed to another category of visualization, which concerns representation of primarily the physical nature of its subject (i.e. the physical shape of a molecule, where the significance is placed on its shape, rather than numeric attributes that describe it). There is overlap between the two categories, but they’re used to describe the primary focus of the diagram (physical versus numeric features). These definitions are discussed further in the third chapter.
As a matter of scope, this thesis considers visual methods for the representation of data (as opposed to other methods, such as sound, see discussion in chapter eight). Because of its ability to process enormous amounts of data, the human visual system lends itself as an exceptional tool to aid in the understanding of complex subjects.
1.2
process
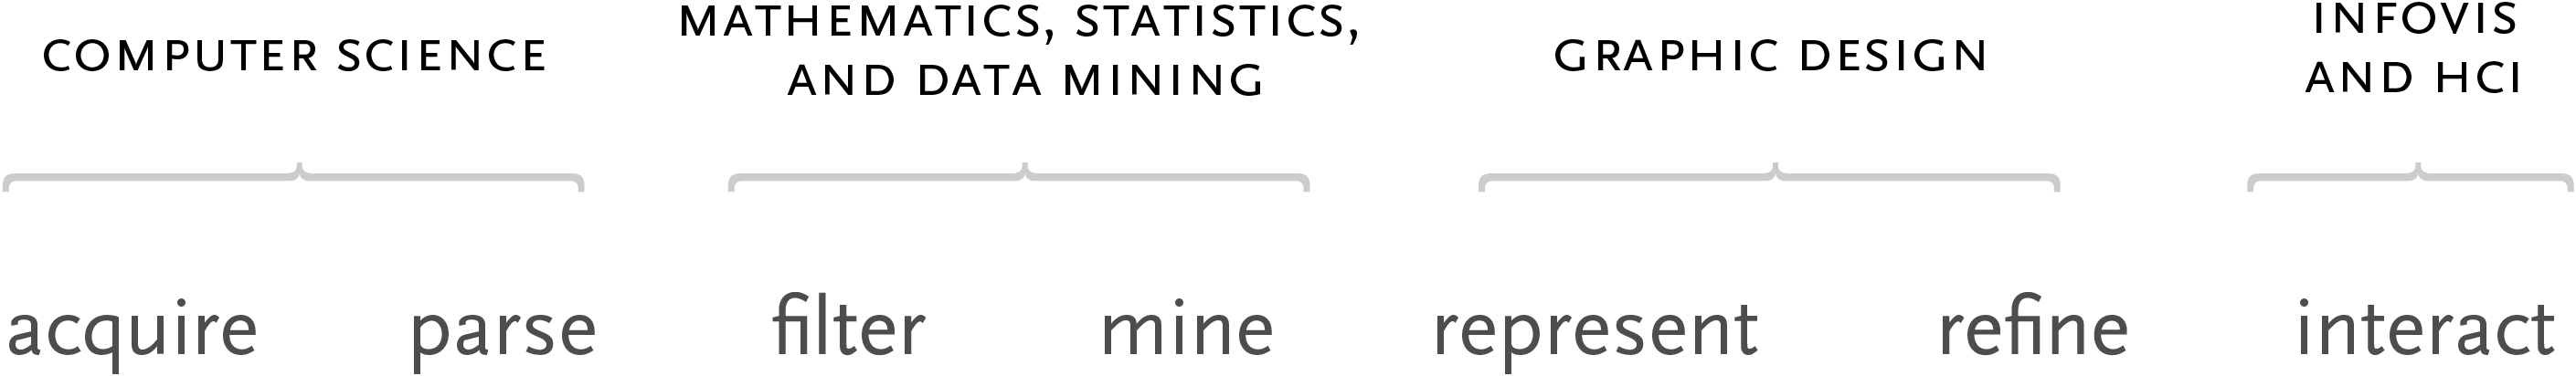
The process of understanding data begins with a set of numbers and a goal of answering a question about the data. The steps along this path can be described as follows:
1. acquire – the matter of obtaining the data, whether from a file on a disk or from a source over a network.
2. parse – providing some structure around what the data means, ordering it into categories.
3. filter – removing all but the data of interest.
4. mine – the application of methods from statistics or data mining, as a way to discern patterns or place the data in mathematical context.
5. represent – determination of a simple representation, whether the data takes one of many shapes such as a bar graph, list, or tree.
6. refine – improvements to the basic representation to make it clearer and more visually engaging.
7. interact – the addition of methods for manipulating the data or controlling what features are visible.
Part of the problem with the individual approaches of dealing with data is that the separation of the fields leads to each person solving an isolated part of the problem, and along the path towards a solution, something is lost at each transition—a “telephone game” for context, where each step of the process diminishes aspects of the initial question under consideration. The initial format of the data (how it is acquired and parsed) will often drive how it is structured to be considered for filtering and statistics or data mining. The statistical method used to glean useful information from the data might drive how the data is initially presented—the representation is of the results of the statistical method, rather than a response to the initial question.
A graphic designer brought in at the next stage will most often respond to specific problems with its representation as provided by the previous steps, rather than focusing on the initial question itself. Implementation of the visualization step might add a compelling and interactive means to look at the data filtered from the earlier steps, but the result is an in-depth, interactive look at a data set, using a particular statistical model, not a clear answer to the original question.
Further, for practitioners of each of the fields that commonly deal with data problems, it’s often unclear the necessary methods to make it through the wider set of steps necessary to arrive at a solution to the problem in question.
This thesis describes the background of each of the individual fields in chapter three, while chapter five describes this process in depth, also citing the unique aspects of their combination.
1.3
tools
An integrated approach usually implies that a single person is meant to handle the entire process. For larger projects, it might be possible to have one such person oversee the process as acted out by others, but still requires that person be thoroughly versed in the individual issues in order to maintain the same kind broad overview of the process.
The focus of this thesis is on the single practitioner, and the way that single practitioners are enabled is by better tools. Where video production was once exclusively the domain of large teams of people with expensive equipment, it’s now possible to edit movies on a desktop workstation through tools that better enable individual users. This hasn’t lead to the larger teams disappearing, but highlights the power of individual practitioners enabled by the right tools.
As a necessary supplementary component, a tool called Processing has been developed in conjunction with this research. It is a Java-based software development environment that aims to simplify the construction of graphically-oriented software. This goal helps beginners with programming concepts by placing the more interesting parts at the surface, while also providing a sketching environment for advanced users.
The majority of the projects described in this dissertation were developed using Processing, and provide examples of its capabilities.
Processing was conceived of and implemented by Casey Reas and this author, and is supported by an international community of collaborators. The project is discussed further in chapter six.
1.4
domain
While every problem is unique, the principles remain the same across data sets and across domains. This dissertation has a particular focus on the application of these methods across data problems from genetics. A domain was chosen so that specific examples could be addressed as a real test for the process introduced in this dissertation.
The difficulty in selecting a problem domain is that the reader must then come to understand parts of that domain in order to evaluate the strength of the solution. For this reason, the initial introduction of the process in chapter two uses a far simpler data set.
In spite of a focus on genetics, the issues are identical to those that must be considered by practitioners in other data-oriented fields. Chapter four describes a specific example concerning genetic variation data, and additional genetics projects are outlined in chapter seven, which catalogs information design experiments across several additional problem domains.