Computational Information Design
2 Basic Example
This section describes application of the Computational Information Design process to the understanding of a simple data set—the zip code numbering system used by the United States Postal Service. The application demonstrated here is purposefully not an advanced one, and may even seem foolish, but it provides a skeleton for how the process works.
2.1
questions & narrative
All data problems begin with a question. The answer to the question is a kind of narrative, a piece that describes a clear answer to the question without extraneous details. Even in the case of less directed questions, the goal is a clear discussion of what was discovered in the data set in a way that highlights key findings. A stern focus on the original intent of the question helps the designer to eliminate extraneous details by providing a metric for what is and is not necessary.
2.2
background
The project described here began out of an interest in how zip codes relate to geographic area. Living in Boston, I knew that numbers starting with a zero were on the East Coast. Having lived in San Francisco, I knew the West Coast were all nines. Growing up in Michigan, all our codes were 4-prefixed. In addition, what sort of area does the second digit specify? Or the third?
The finished application, called zipdecode, was initially constructed in a matter of a few hours as a way to quickly take what might be considered a boring data set (45,000 entries in a long list of zip codes, towns, and their latitudes & longitudes) and turn it into something that explained how the codes related to their geography and, as it turned out, was engaging for its users.
2.3
process
The Computational Information Design process, as it relates to the data set and question under examination here.
2.3.1 Acquire

The acquisition step refers to obtaining the data, whether over the network, or from a file on a disk. Like many of the other steps, this can often be extremely complicated (i.e. trying to glean useful data out of a large system) or very simple (simply reading a readily available text file).
The acronym zip stands for Zoning Improvement Plan, and refers to a 1963 initiative to simplify the delivery of mail in the United States. Faced with an ever-increasing amount of mail to be processed, the zip system intended to simplify the process through a more accurate specification of geographic area where the mail was to be delivered. A more lengthy background can be found on the U.S. Postal Service’s web site.
Today, the zip code database is primarily available via the U.S. Census Bureau, as they use it heavily as a method for geographic coding of information. The listing is a freely available file with approximately 45,000 lines, one for each of the codes:
00210 +43.005895 -071.013202 U PORTSMOUTH 33 015
00211 +43.005895 -071.013202 U PORTSMOUTH 33 015
00212 +43.005895 -071.013202 U PORTSMOUTH 33 015
00213 +43.005895 -071.013202 U PORTSMOUTH 33 015
00214 +43.005895 -071.013202 U PORTSMOUTH 33 015
00215 +43.005895 -071.013202 U PORTSMOUTH 33 015
00501 +40.922326 -072.637078 U HOLTSVILLE 36 103
00544 +40.922326 -072.637078 U HOLTSVILLE 36 103
00601 +18.165273 -066.722583 ADJUNTAS 72 001
00602 +18.393103 -067.180953 AGUADA 72 003
00603 +18.455913 -067.145780 AGUADILLA 72 005
00604 +18.493520 -067.135883 AGUADILLA 72 005
00605 +18.465162 -067.141486 P AGUADILLA 72 005
00606 +18.172947 -066.944111 MARICAO 72 093
00610 +18.288685 -067.139696 ANASCO 72 011
00611 +18.279531 -066.802170 P ANGELES 72 141
00612 +18.450674 -066.698262 ARECIBO 72 013
00613 +18.458093 -066.732732 P ARECIBO 72 013
00614 +18.429675 -066.674506 P ARECIBO 72 013
00616 +18.444792 -066.640678 BAJADERO 72 013
2.3.2 Parse
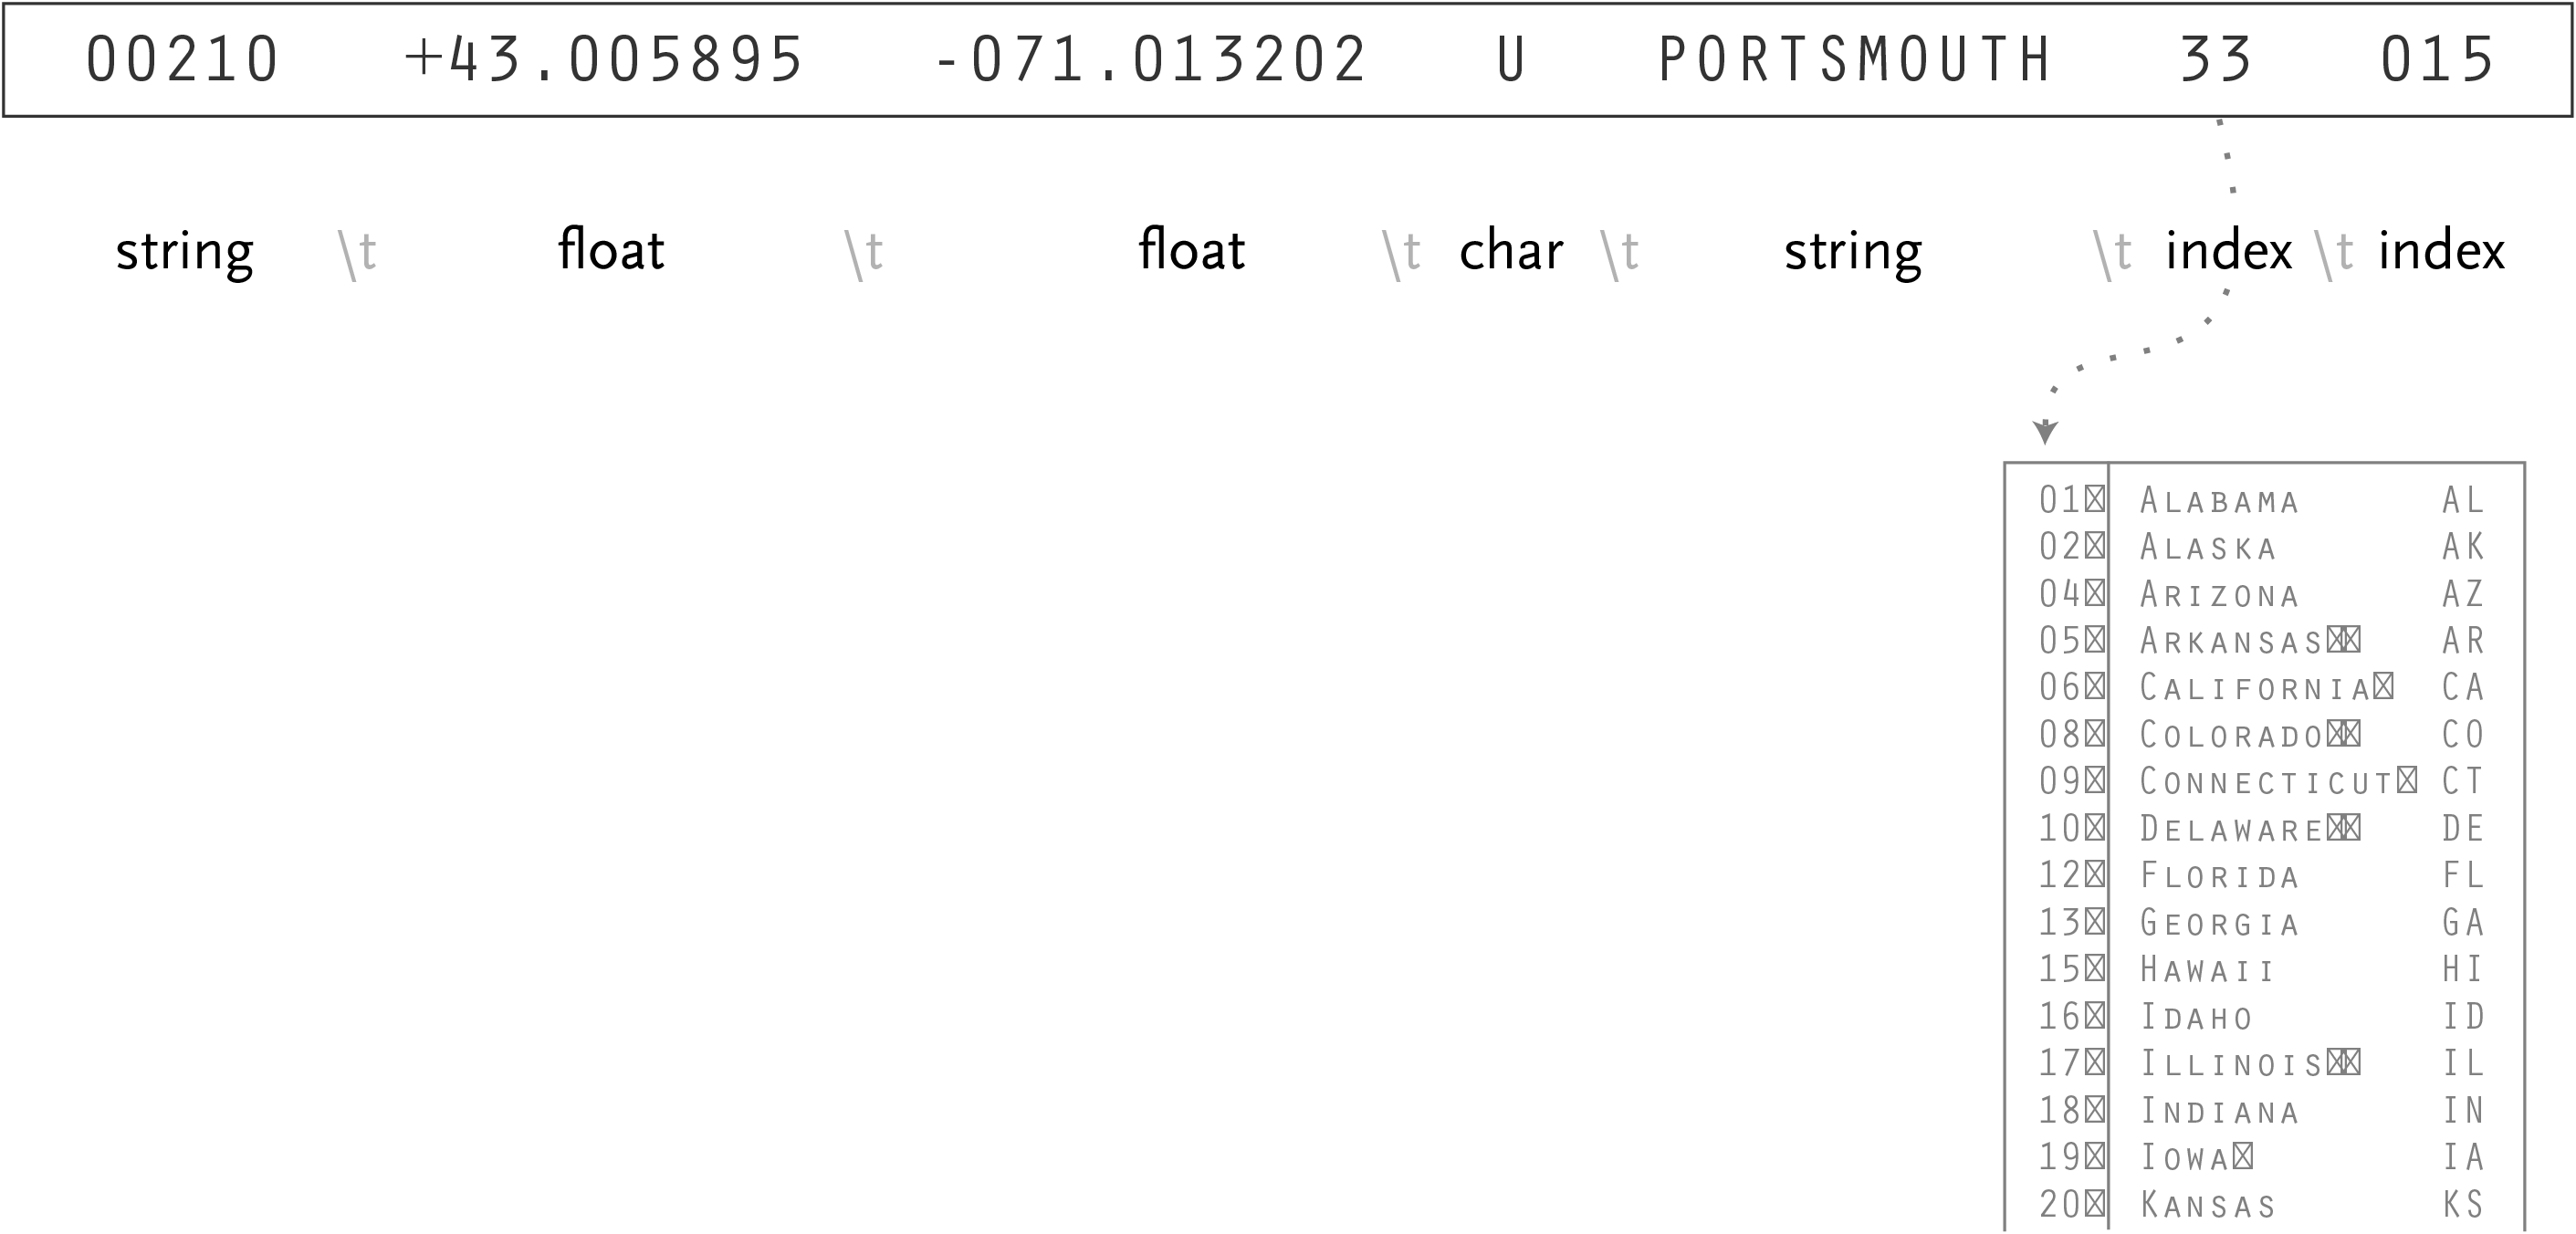
Having acquired the data, it next needs to be parsed—changed into a format that tags the meaning of each part of the data with how it is to be used. For each line of the file, it must be broken along its individual parts, in this case the line of text is separated by tabs. Next, each piece of data is converted to its useful format:
string – a set of characters that forms a word or a sentence (used for city/town names), or because the zip codes themselves are not so much numbers as a series of digits (if they were numbers, then the code 02139 would be the same as 2139, which is not the case) they are also considered a string.
float – a number with decimal points (used for the latitudes and longitudes of each location). The name is short for “floating point,” from programming nomenclature of how the numbers are stored in the computer’s memory.
char – a single character, in this data set sometimes used as a marker for the designation of special post offices.
integer – any generic number
index – data (commonly it might be an integer or string) that points to another table of data (in this case, mapping numbered “fips” codes to the names and two digit abbreviations of states)
Having completed this step, the data is successfully tagged and more useful to a program that will manipulate or represent it in some way. This is common in the use of databases, where a such a code is used as a lookup into another table, sometimes as a way to compact the data further (i.e. a two digit code is better than listing the full name of the state or territory).
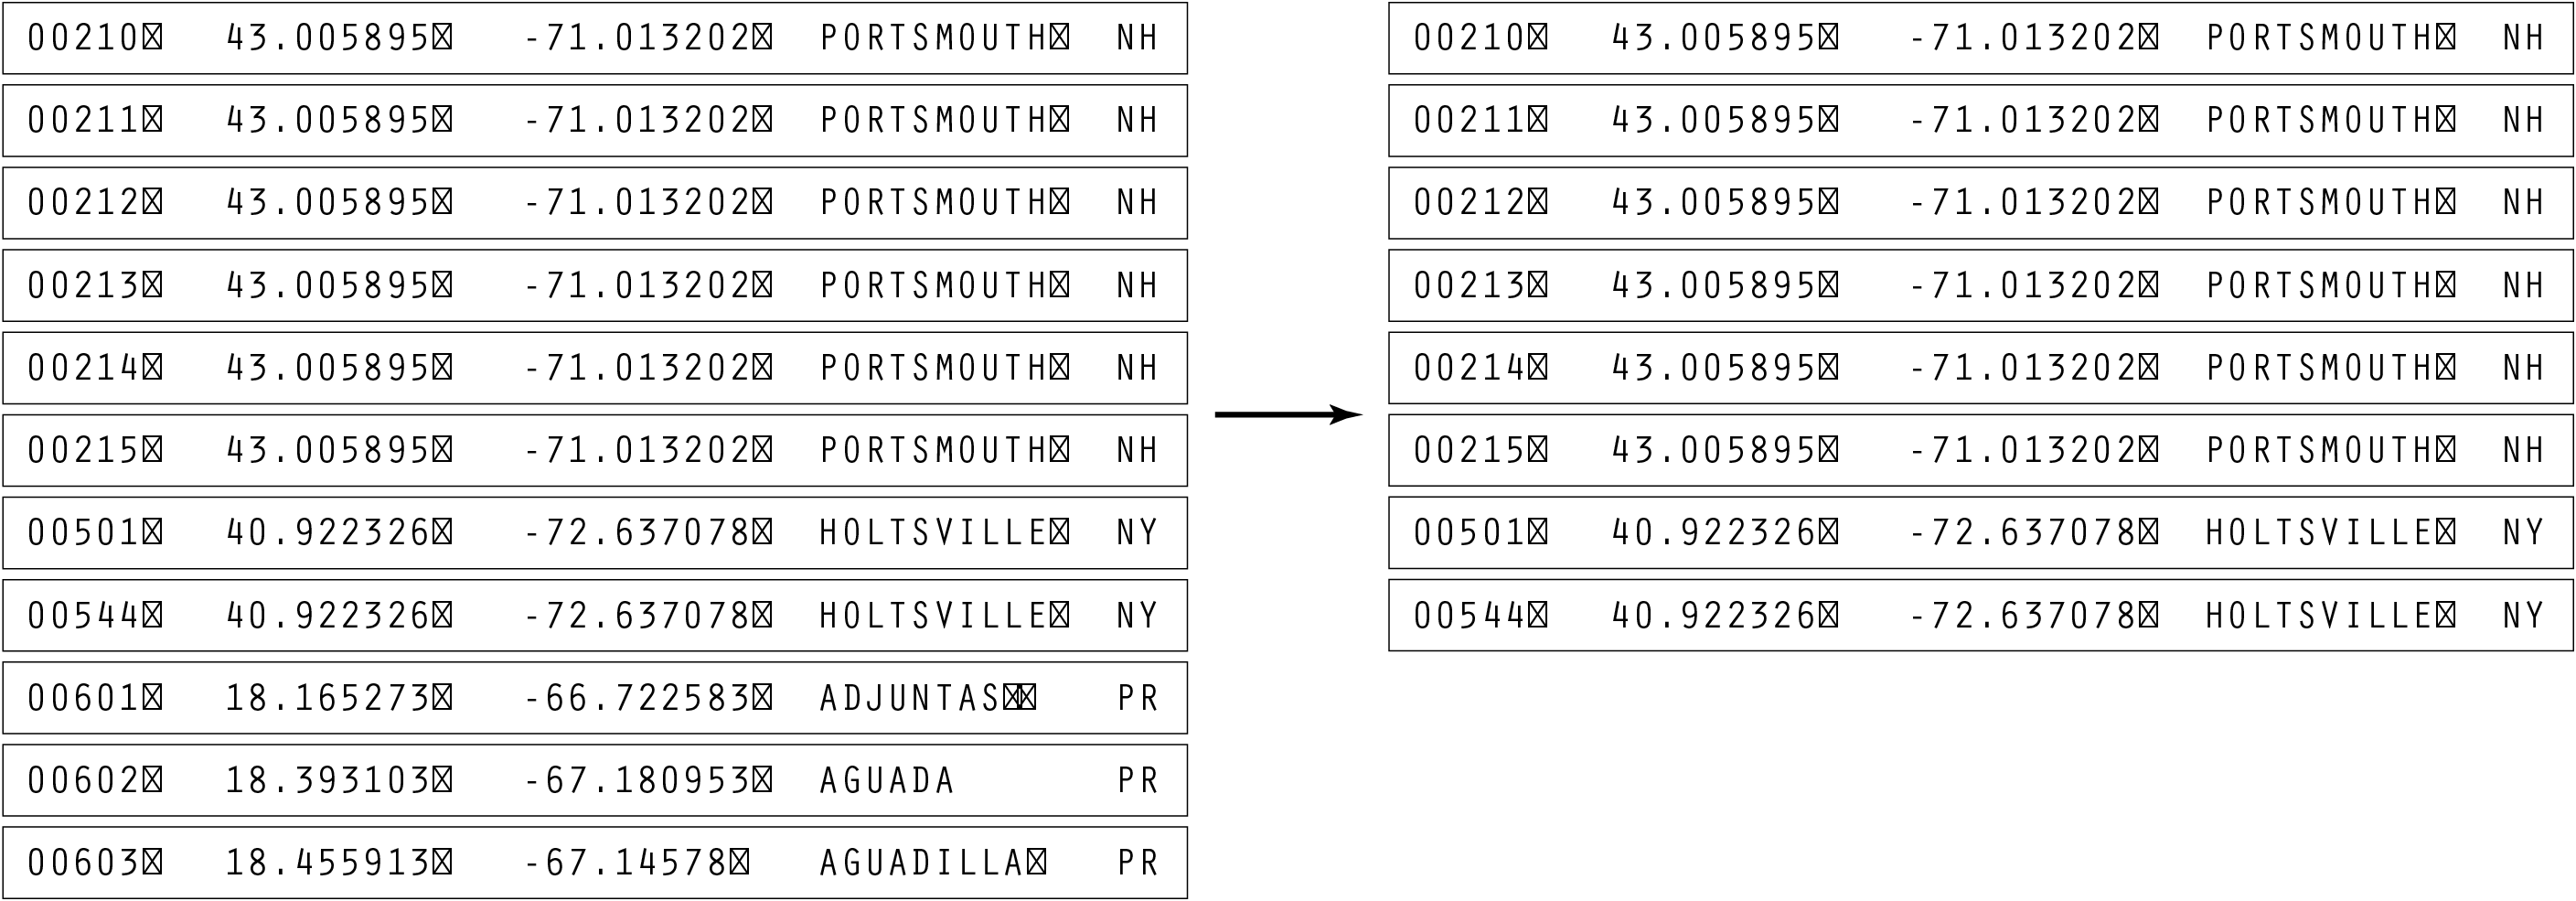
2.3.3 Filter
The next step involves the filtering of data, in this case the records not part of the contiguous 48 states will be removed. This means Alaska and Hawaii will be removed (as this is only a simple sketch) along with other territories such as Puerto Rico.
Again, while simplistic in this project, this is often a very complicated and can require significant mathematical work to place the data into a mathematical “model” or normalize it (convert it to an acceptable range of numbers). In this example, a basic normalization is used to re-orient the minimum and maximum longitudes and latitudes to range from zero to the width and height of the display. More of the mathematical approaches to filtering are discussed in chapter six.
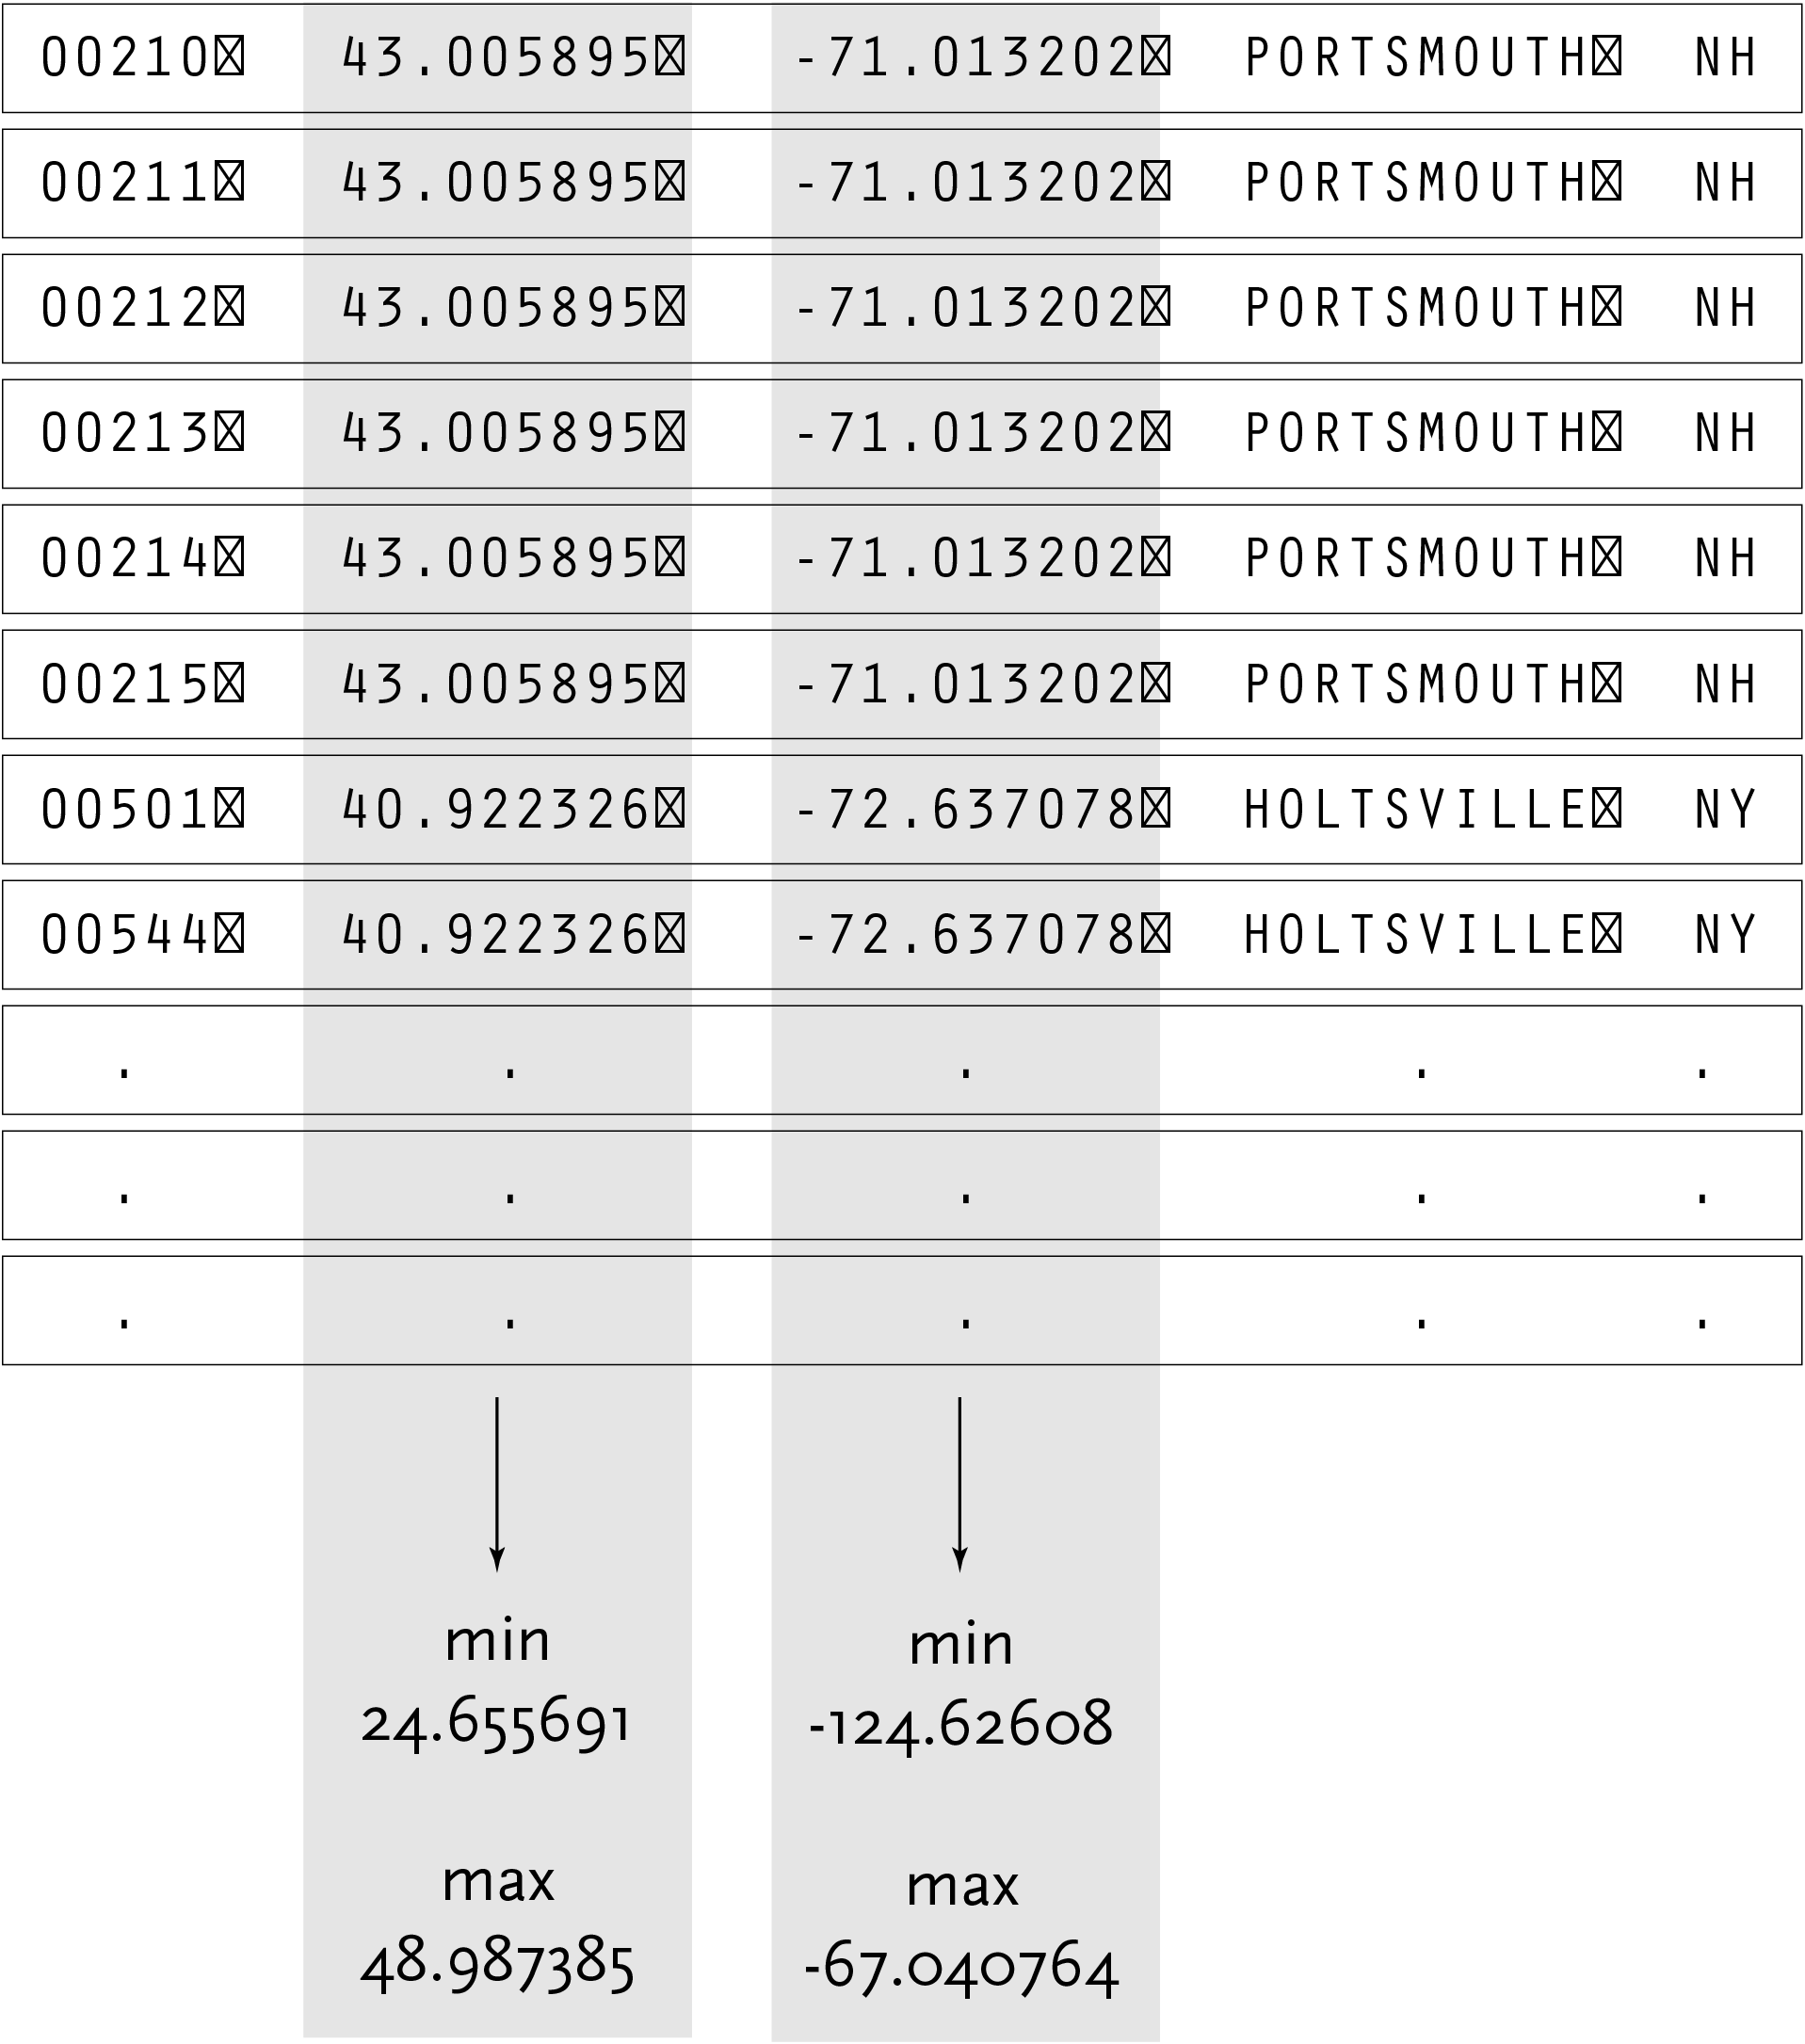
2.3.4 Mine
This step involves basic math, statistics and data mining. The data in this case receives only simple treatment: the program must figure out the minimum and maximum values for latitude and longitude, so that the data can be presented on screen at a proper scale.
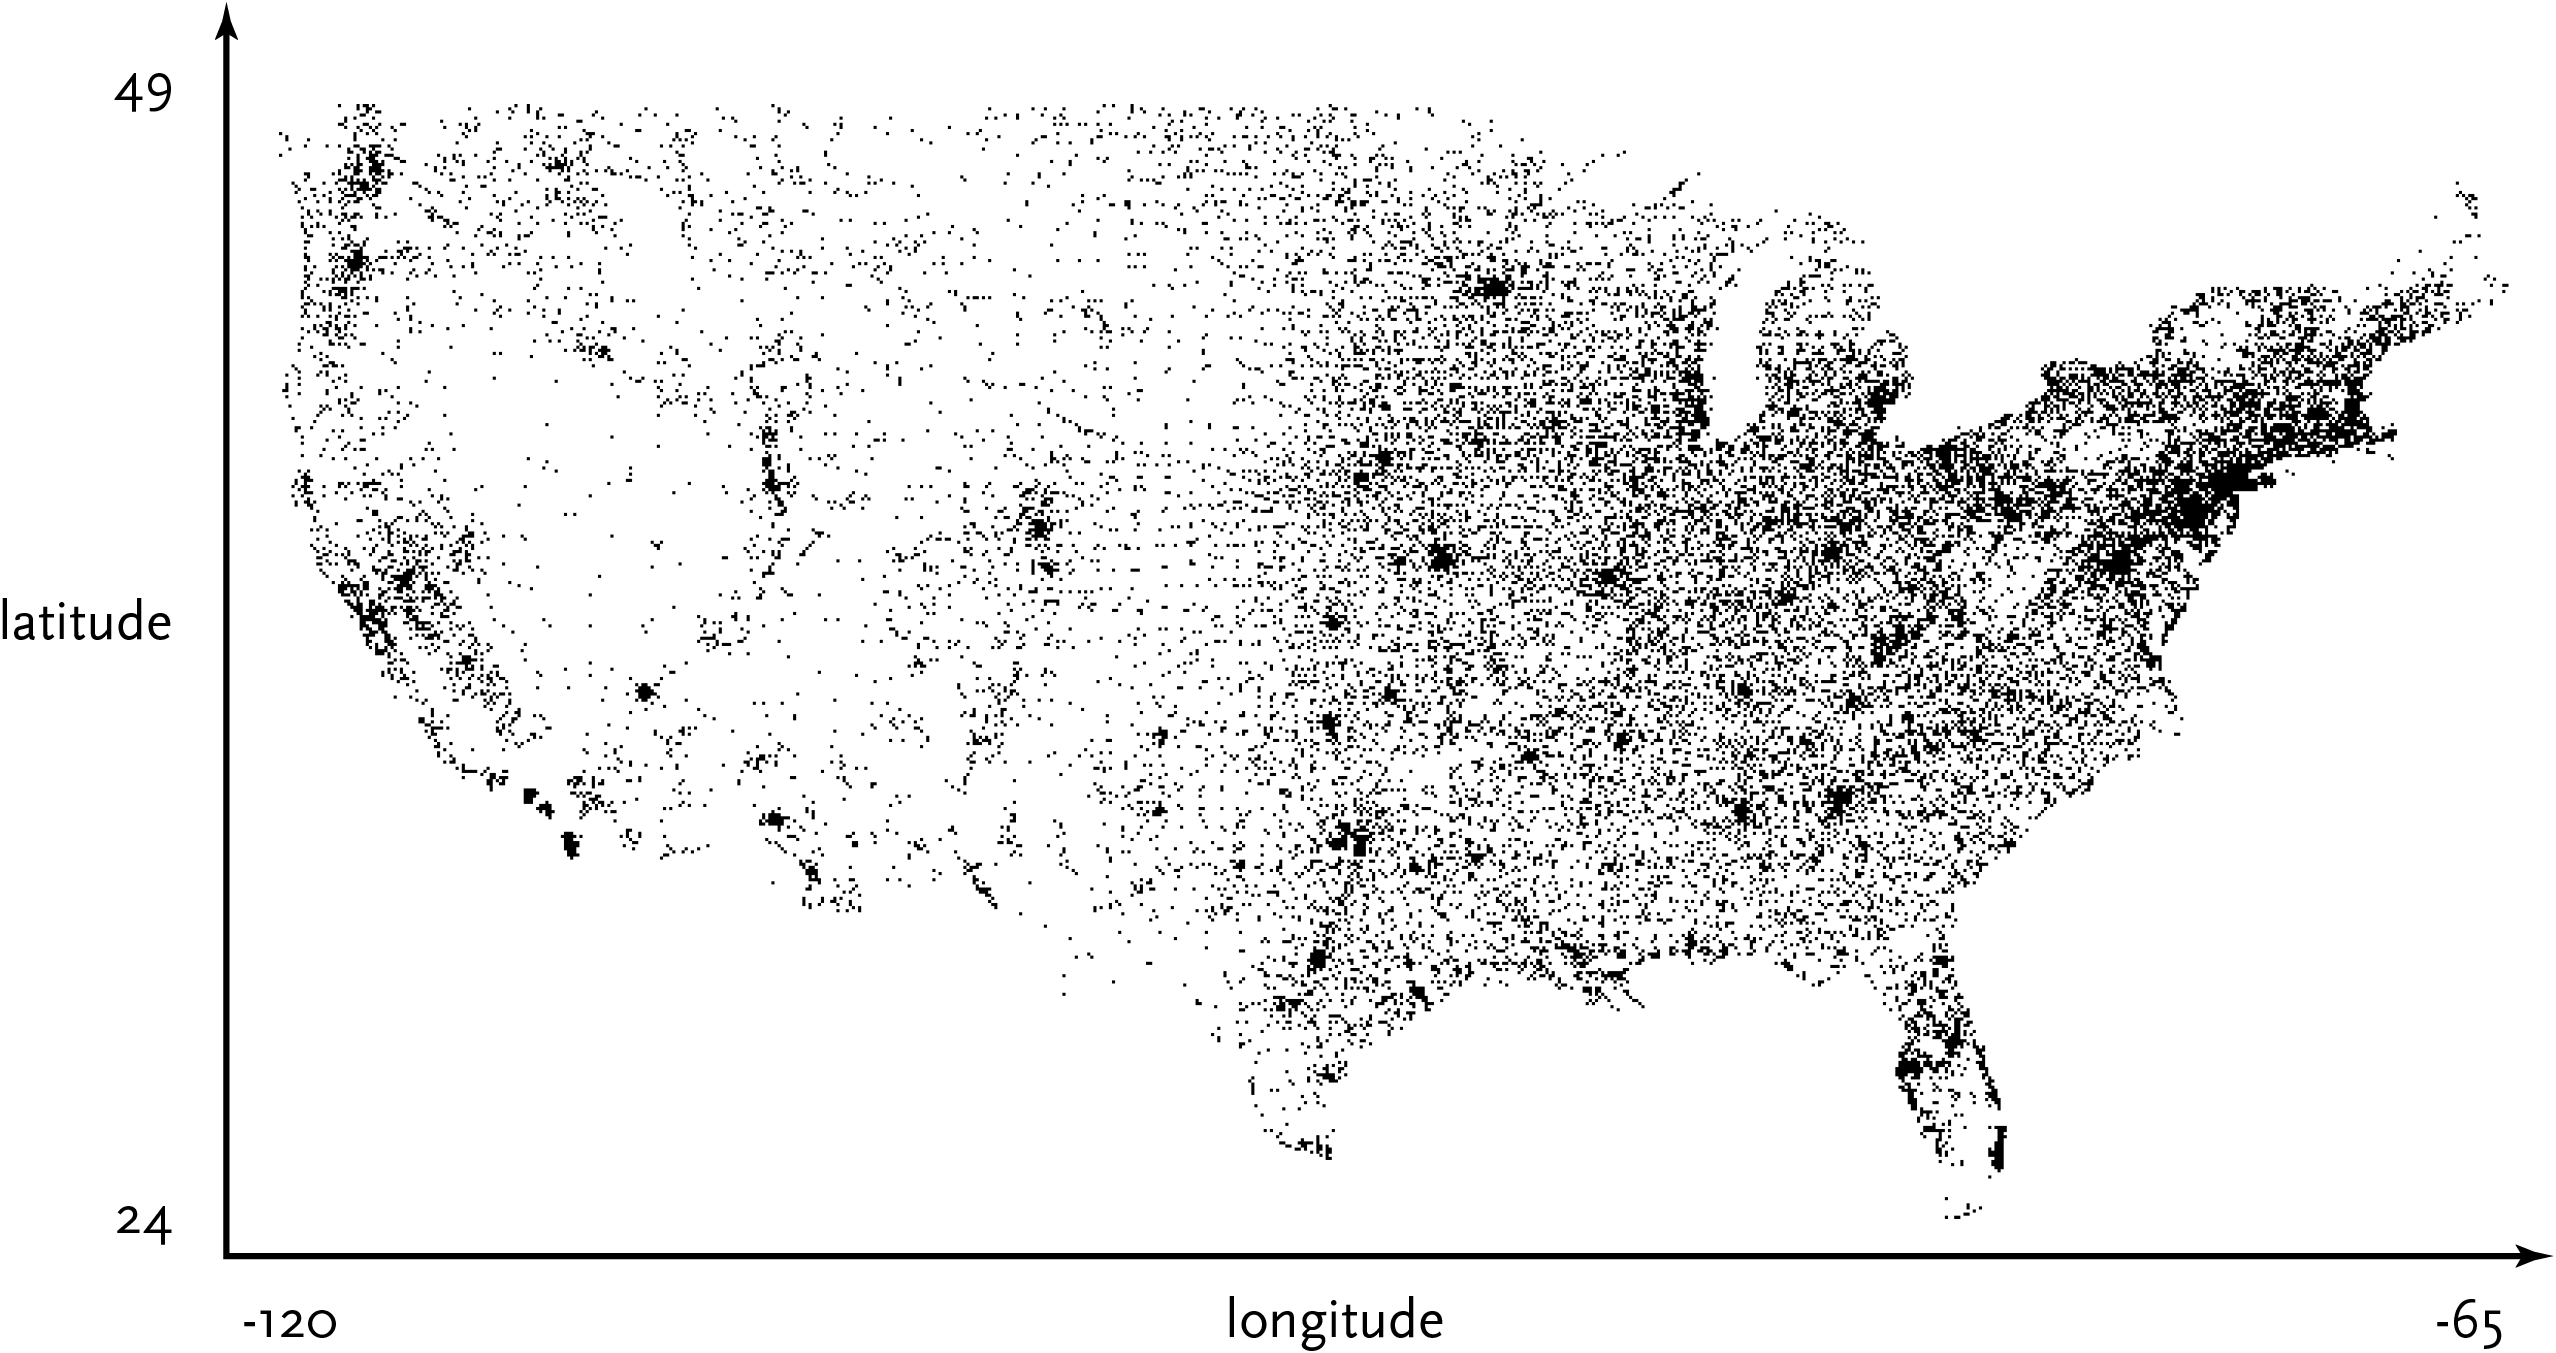
2.3.5 Represent
The representation step has to do with the basic form that a set of data will take. Some data are lists, others are structured like trees. In this case, each zip code has a latitude and longitude, so they can be mapped as a two-dimensional plot, with the minimum and maximum values for the latitude and longitude being used for the start and end of the scale in each dimension.
2.3.6 Refine
In the refinement step, the graphic design methods are used to more clarify the representation by calling more attention to particular data (establishing hierarchy), or changing attributes like color that have an impact on how well the piece can be read. The coloring becomes a deep gray, and each point a medium yellow signifying that all the points are currently selected.
2.3.7 Interact
The next stage of the process adds interaction as a way to give the user a way to control or explore the data. Interaction might cover things like selecting a subset of the data (controlling the filter) or changing the viewpoint. It can also affect the refinement step, as a change in viewpoint might require the data to be designed differently.
In the zipdecode piece, typing a number begins the selection of all zip codes that begin with that number. The following images show all the zip codes beginning with zero, four, and nine respectively.
As the user will often want to traverse laterally—running through several of these prefixes, holding down the shift key will allow them to replace the last letter typed, without having to hit the ‘delete’ key to back up.
The interaction is primitive, but allows the user to very rapidly gain an understanding of how the layout of the postal system works.
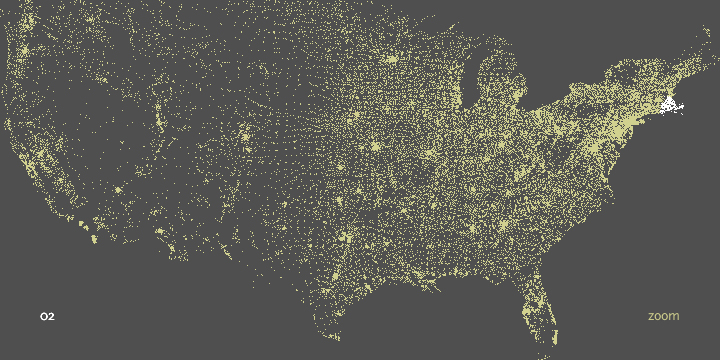

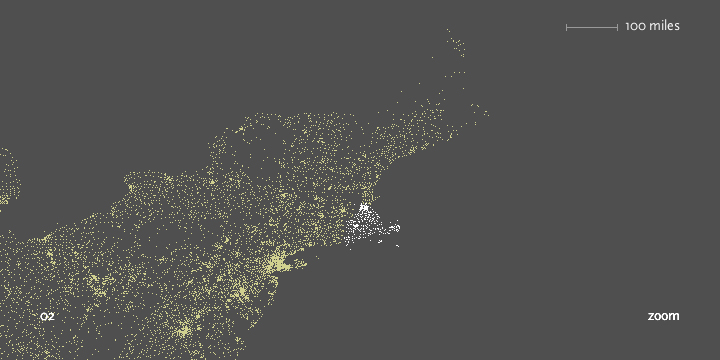
Past the initial number, the viewer can continue to type digits to see the area covered by each subsequent set of prefixes:
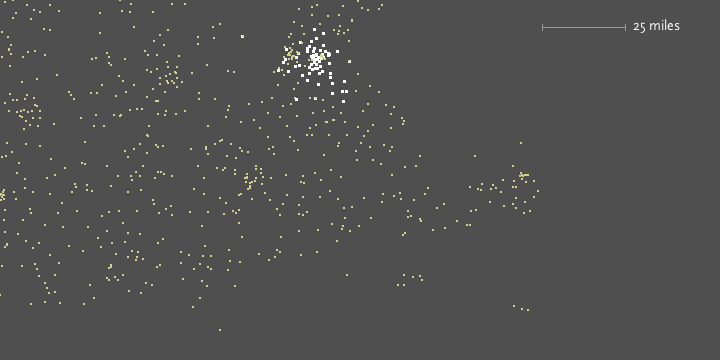
Prefix ‘0’ is New England, ‘02’ covers Eastern Massachusetts.
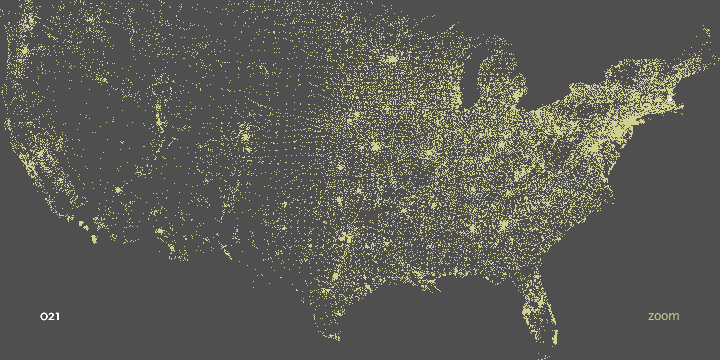
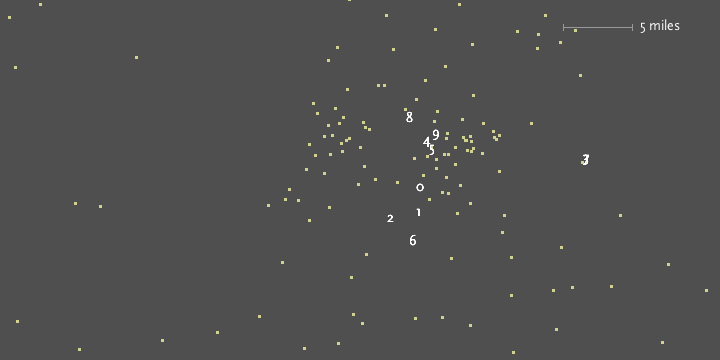
‘021’ limits down to entries in Middlesex County, and ‘0213’ is a grouping of nearby cities.
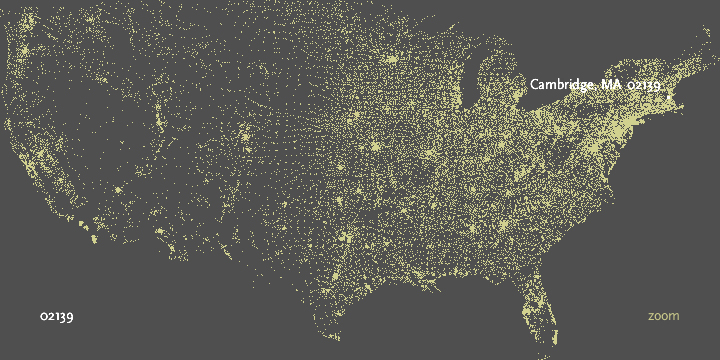
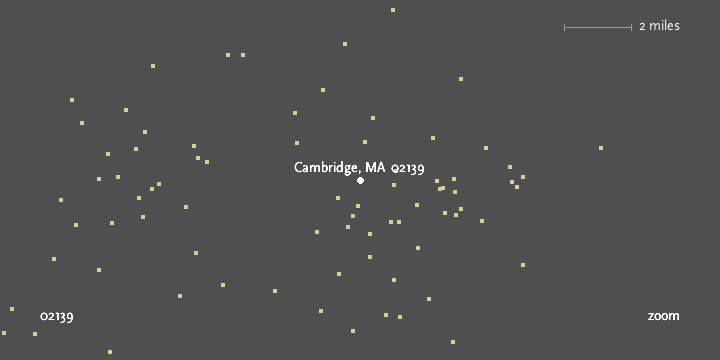
Finally, ‘02139’ hones in on Cambridge, ma itself.
In addition, users can enable a ‘zoom’ feature which draws them closer to each specific choice as they’re made, to reveal more detail around the area. Each level of zoom adds more detail to the features, so that a constant rate of details is seen at each level. In the case of mapping, additional details of state and county boundaries, or other geographic features that help the viewer associate the “data” space of zip code points to what they know about the local environment.
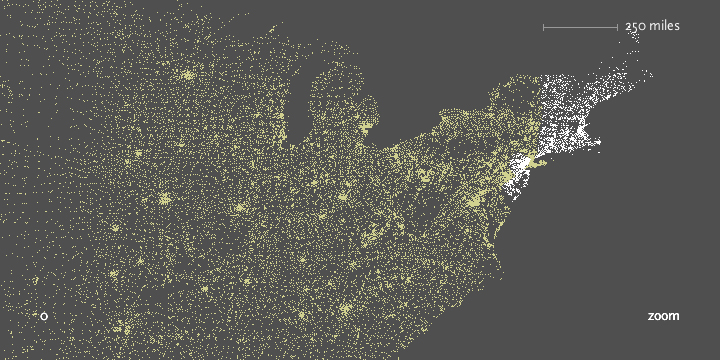
This notion of re-layering the data as the perspective shifts is a useful aspect of computational design, a unique feature that comes from the combination of several of the steps involved.
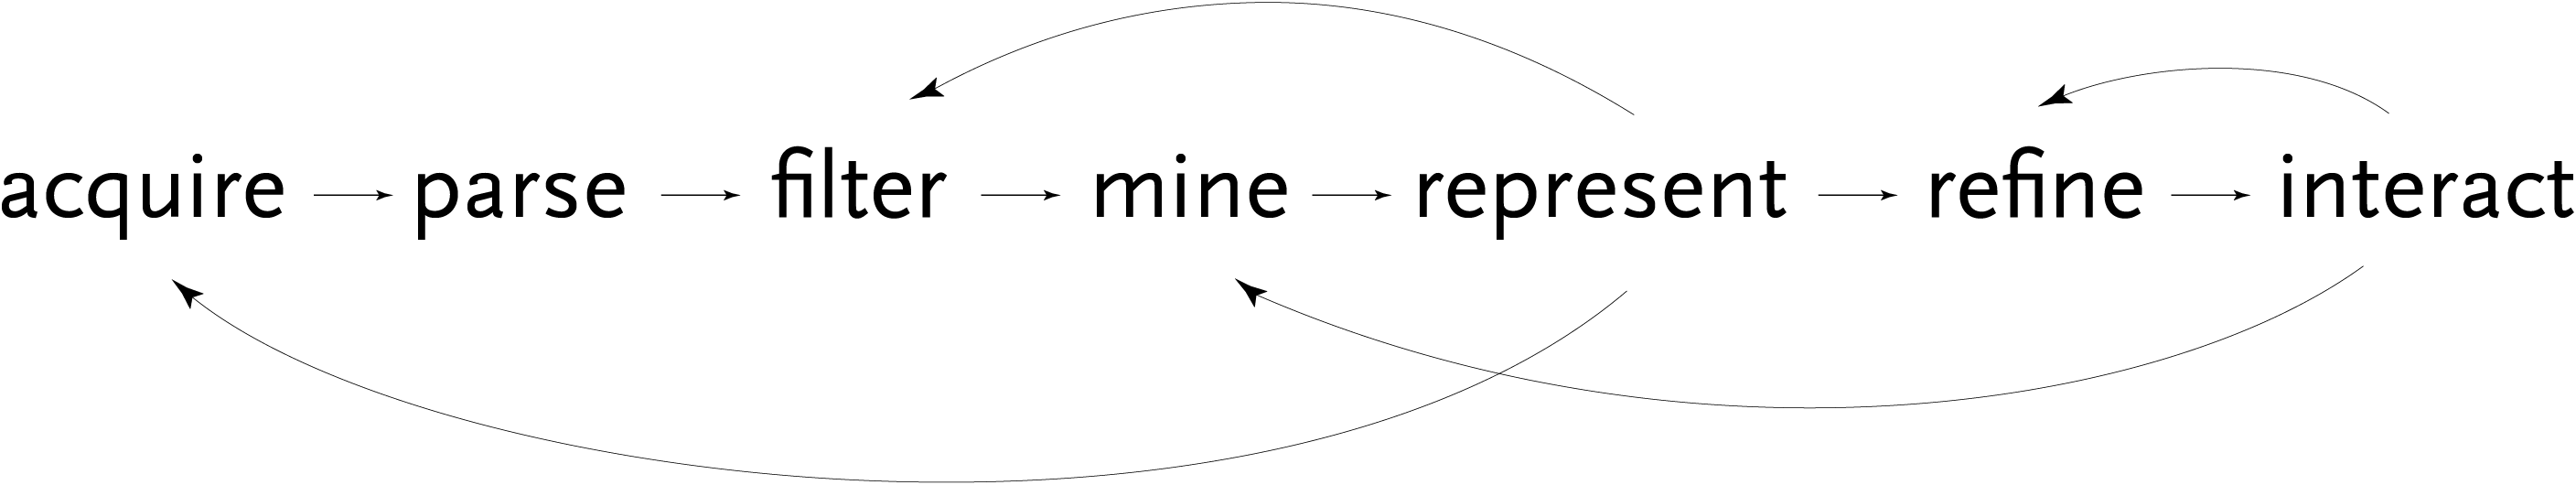
Not visible in the steps shown so far is the kind of iteration that went into the project. Each step of the process is inextricably linked because of how they affect one another. Because of the need for the representation to fit on the screen in a compact way, the data was re-filtered to exclude territories not part of the contiguous 48 states.
The method of interaction by typing successive numbers impacted the visual refinement step, where the colors were modified to show a slow transition as points in the display were added or removed. This prevents the interaction from becoming too jarring and helps the user maintain context.
Later, the representation step affected the acquisition step, as the application was modified to show the data as it was downloaded over what might be a slow internet connection. This allows the points to slowly appear as they are first read from the data file as it is streamed over the network—employing the data itself as a “progress bar” to depict completion.
The interconnections between the steps of the Computational Information Design process helps illustrate the importance of addressing the fields as a whole.
2.3.8 Properties
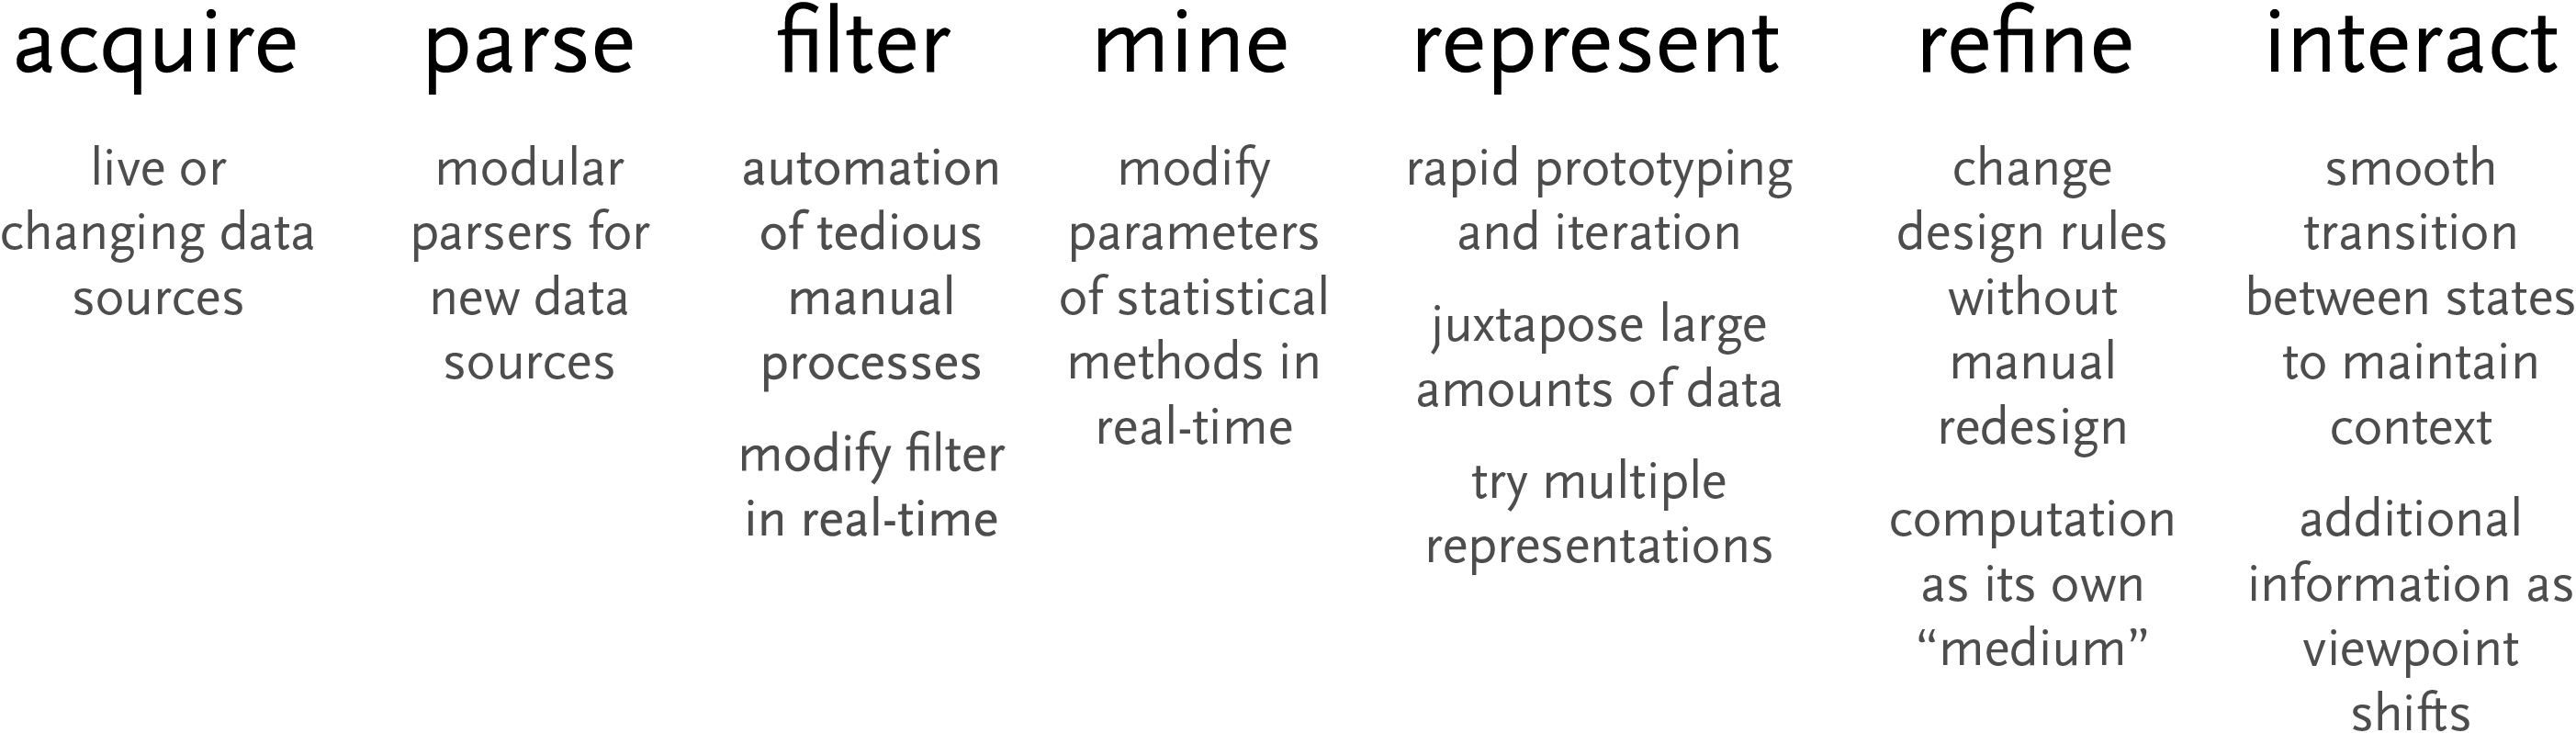
At the intersection between these fields are the more interesting set of properties that demonstrate the strength of their combination.
In terms of acquisition, consideration is given to data that can be changed, whether once a month or on a continuous basis. This opens up the notion of the focus of graphic design on solving a specific problem for a specific data set, and instead considers the meta-problem of how to handle a certain kind of data, that might be updated in the future.
In the filtering step, data can be filtered in real time, as it is done in the zipdecode application. In terms of visual refinement, changes to the design can be applied across the entire system. For instance, a color change can be automatically applied to the thousands of elements that require it, rather than requiring the designer to painstakingly make such a tedious modification. This is the strength of a computational approach, where tedious processes are minimized through automation.
Moving further ahead, by making these methods available to a wider audience, the field can mature into a point where “craft” is re-introduced into the medium, that the hand of the advanced practitioner can be seen in the work, even in a medium of the computer, which is typically considered algorithmic, unexpressive, and “cold.”
2.3.9 Conclusion
The zipdecode project doesn’t quite solve a pressing need in the understanding of data, serves to demonstrate the principles used in a Computational Information Design approach. It received a surprising level of response from the viewing public, where as of the time of this writing it receives nearly a thousand visitors a day. This is perhaps surprising for something that might considered as boring as zip code data, and even several months after the projects initial introduction and spike of early interest.