Problem
How to show net solar gain, while also showing consumption and production?
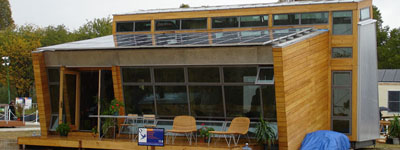
In the 2005 Solar Decathlon house located on Carnegie Mellon’s campus, the most often asked question is, ‘How much energy is the house making right now?”
That’s a bit of a loaded question. The answer relies on two main factors; the amount of sunlight produced and the amount of energy consumed. Both are necessary to determine the net production or consumption of the house.
Is it producing a lot of energy because there is so much sun, or is there only a little sun and we are simply using less energy? Or the house actually producing large amounts of energy but we are consuming more than it makes?
The answer comes from uncontrollable sources (weather) as well as controllable ones (human activity). The challenge becomes to visualize the production, consumption and the net solar gain so that a house occupant can see how the net solar gain is influences by both sources.
The original visualization of the house’s consumption and production failed to convey this information in a clear fashion. This project, built using Processing (processing.org) set out to clarify the information, presenting it in a more compelling and readable manner. The ultimate goal is for house occupants to see the result of human activity, raise energy consumption awareness and influence future energy behavior.