Writing

Rick Astley & Ludacris

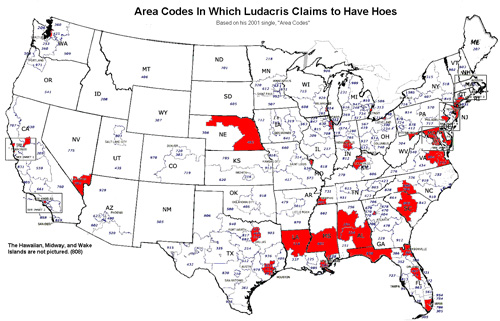
Someday I want to write like Ludacris, but for now I’ll enjoy info graphics of his work. Luda not only knows a lot of young ladies, but can proudly recite the range of area codes in which they live. Geographer (and feminist) Stefanie Gray took it upon herself to make a map:

finalareacodes-500px.jpg

You’ll need background music while taking a look; and I found a quick refresher of the lyrics also informative. More discussion and highlights of her findings can be found on Strange Maps, who first published Stefanie’s image.

In related news, someone else has figured out Rick Astley:

composite-500px.jpg

I’ve added the album cover at left so that you can look into his eyes and see his honest face for yourself. If you’re not a proud survivor of the 80s (or perhaps if you are), the single can be had for a mere 99¢. Or if that only gets you started, you can pick up his Greatest Hits. Someone also made another version of the graphic using the Google chart API (mentioned earlier), though it appears less analytically sound (accurate).

More from song charts at this earlier post.

Saturday, June 14, 2008 | infographics, music  
Book

Visualizing Data Book CoverVisualizing Data is my 2007 book about computational information design. It covers the path from raw data to how we understand it, detailing how to begin with a set of numbers and produce images or software that lets you view and interact with information. When first published, it was the only book(s) for people who wanted to learn how to actually build a data visualization in code.

The text was published by O’Reilly in December 2007 and can be found at Amazon and elsewhere. Amazon also has an edition for the Kindle, for people who aren’t into the dead tree thing. (Proceeds from Amazon links found on this page are used to pay my web hosting bill.)

Examples for the book can be found here.

The book covers ideas found in my Ph.D. dissertation, which is the basis for Chapter 1. The next chapter is an extremely brief introduction to Processing, which is used for the examples. Next is (chapter 3) is a simple mapping project to place data points on a map of the United States. Of course, the idea is not that lots of people want to visualize data for each of 50 states. Instead, it’s a jumping off point for learning how to lay out data spatially.

The chapters that follow cover six more projects, such as salary vs. performance (Chapter 5), zipdecode (Chapter 6), followed by more advanced topics dealing with trees, treemaps, hierarchies, and recursion (Chapter 7), plus graphs and networks (Chapter 8).

This site is used for follow-up code and writing about related topics.