Writing

Temple of Post-Its

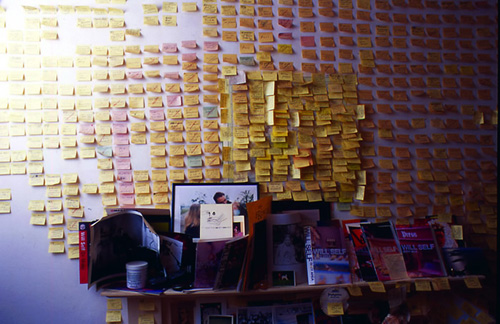
The writing room of author Will Self (Wikipedia), where he organizes his complicated stories through copious use of small yellow (and pink) adhesive papers on the wall:

ws24-wall-500.jpg

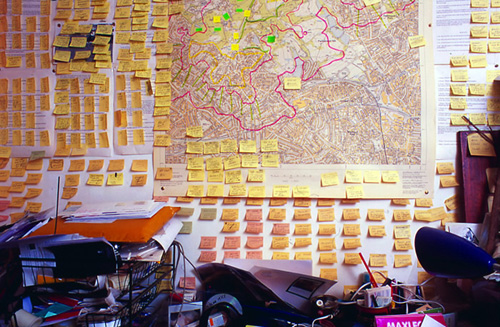
Or amongst a map and more papers:

ws5-map-500.jpg

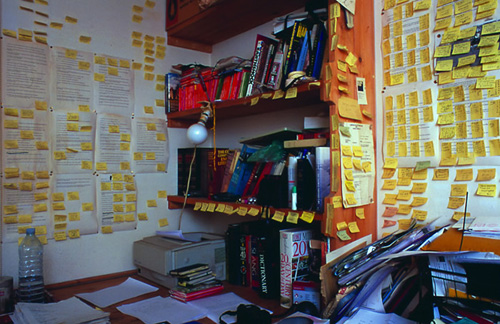
Not even the bookshelf is safe:

ws6-shelf-500.jpg

Check out the whole collection.

Reminds me of taking all the pages of my Ph.D. dissertation (a hundred or so) and organizing them on the floor of a friend’s living room. (Luckily it was a large living room.) It was extremely helpful and productive but frightened my friend who returned home to a sea of paper and a guy who had been indoors all day sitting in the middle of it with a slightly wild look in his eyes.

(Thanks to Jason Leigh, who mentioned the photos during his lecture at last week’s iCore summit in Banff.)

Wednesday, September 3, 2008 | collections, organize  
Book

Visualizing Data Book CoverVisualizing Data is my 2007 book about computational information design. It covers the path from raw data to how we understand it, detailing how to begin with a set of numbers and produce images or software that lets you view and interact with information. When first published, it was the only book(s) for people who wanted to learn how to actually build a data visualization in code.

The text was published by O’Reilly in December 2007 and can be found at Amazon and elsewhere. Amazon also has an edition for the Kindle, for people who aren’t into the dead tree thing. (Proceeds from Amazon links found on this page are used to pay my web hosting bill.)

Examples for the book can be found here.

The book covers ideas found in my Ph.D. dissertation, which is the basis for Chapter 1. The next chapter is an extremely brief introduction to Processing, which is used for the examples. Next is (chapter 3) is a simple mapping project to place data points on a map of the United States. Of course, the idea is not that lots of people want to visualize data for each of 50 states. Instead, it’s a jumping off point for learning how to lay out data spatially.

The chapters that follow cover six more projects, such as salary vs. performance (Chapter 5), zipdecode (Chapter 6), followed by more advanced topics dealing with trees, treemaps, hierarchies, and recursion (Chapter 7), plus graphs and networks (Chapter 8).

This site is used for follow-up code and writing about related topics.