
NASA Earth Observatory
 Some potentially interesting data from NASA passed along by Chris Lonnen. The first is the Earth Observatory, which includes images of things like Carbon Monoxide, Snow Cover, Surface Temperature, UV Exposure, and so on. Chris writes:
I’m not sure how useful they would be to novices in terms of usable data (raw numbers are not provided in any easy to harvest manner), but the information is
still useful and they provide for a basic, if clunky, presentation that follows the basic steps you laid out in your book. They data can be found here, and they occasionally compile it all into interesting visualizations. My favorite being the carbon map here.
The carbon map movie is really cool, though I wish the raw data were available since the strong cyclical effect seen in the animation needs to be separated out. The cycles dominates the animation to such an extent that it’s nearly the only takeaway from the movie. For instance, each cycle is a 24 hour period. Instead of showing them one after another, show several days adjacent one another, so that we can compare 3am with one day to 3am the next.
For overseas readers, I’ll note that the images and data are not all U.S.-centric—most cover the surface of the Earth.
I asked Chris about availability for more raw data, and he did a little more digging:
The raw data availability is slim. From what I’ve gathered you need to contact NASA and have them give you clearance as a researcher. If you were looking for higher quality photography for a tutorial NASA Earth Observations has a newer website that I’ve just found which offers similar data in the format of your choice at up to 3600 x 1800. For some sets it will also offer you data in CSV or CSV for Excel.
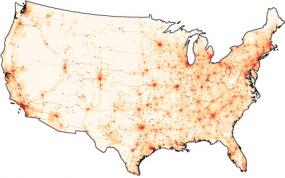
If you needed higher resolutions that that NASA’s Visible Earth offers some TIFF’s at larger sizes. A quick search for .tiff gave me an 16384 x 8192 map of the earth with city lights shining, which would be relatively easy to filter out from the dark blue background. These two websites are probably a bit more helpful.
Interesting tidbits for someone interested in a little planetary digging. I’ve had a few of these links sitting in a pile waiting for me to finish the “data” section of my web site; in the meantime I’ll just mention things here.
Update 31 July 2008: Robert Simmon from NASA chimes in.
