
iPolljunkie, iPoliticsobsession, iFix, iLackawittytitle
I apologize that I’ve been too busy and distracted with preparing Processing 1.0 to have any time to post things here, but here’s a quickie so that the page doesn’t just rot into total embarrassment.
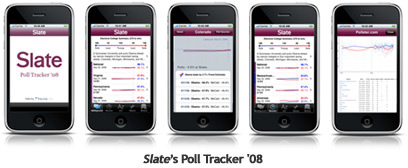
Slate this morning announced the availability of a poll tracking application for the iPhone:
I haven’t yet ponied up ninety nine of my hard-earned cents to buy it but find it oddly fascinating. Is there actually any interest for this? Is this a hack? Is there a market for such things? Is the market simply based on the novelty of it? Is it possible to quantify the size of the poll-obsessed political junkie market? And how is that market comprised—what percentage of those people are part of campaigns, versus just people who spend too much time reading political news? (I suspect the former is negligible, but may be tainted as a card-carrying member of the latter group.)
To answer my own questions, I suspect that it was thrown together by a couple of people from the tech side of the organization (meaning “hack” in the best sense of the word), who then sold management on it, with the rationale of 1) it’ll generate a little press (or hype on, um, blogs), 2) it’ll reinforce Slate readers’ interest in or connection to the site, and 3) it’s a little cool and trendy. I don’t think they’re actually planning to make money on it (or recoup any development costs), but that the price tag has more to do with 99¢ sounds more valuable and interesting than a free giveaway.
Of course, anyone with more interesting insights (let alone useful facts), please pass them along. I’m hoping it’s an actual Cocoa app, and not just a special link to web pages reformatted for the iPhone, which would largely invalidate this post and extinguish my own curiosity about the beast.
Update: The application is a branded reincarnation of a poll tracker developed by Aaron Brethorst at Chimp Software. Here’s his blog post announcing the change, and even a press release.
