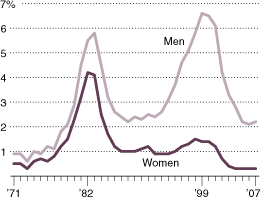
What has driven women out of Computer Science?
 Casey yesterday noted this article from the New York Times on the declining number of women who are pursuing computer science degrees. Declining as in “wow, weren’t the numbers too low already?” From the article’s introduction:
ELLEN SPERTUS, a graduate student at M.I.T., wondered why the computer camp she had attended as a girl had a boy-girl ratio of six to one. And why were only 20 percent of computer science undergraduates at M.I.T. female? She published a 124-page paper, “Why Are There So Few Female Computer Scientists?”, that catalogued different cultural biases that discouraged girls and women from pursuing a career in the field. The year was 1991.
Computer science has changed considerably since then. Now, there are even fewer women entering the field. Why this is so remains a matter of dispute.
The article goes on to explain that even though there is far better gender parity (since 1991) when looking at roles in technical fields, computer science still stands alone in moving backwards.
The text also covers some of the “do it with gaming!” nonsense. As someone who became interested in programming because I didn’t like games, I’ve never understood why gaming was pushed as a cure-all for disinterest in programming:
Such students who choose not to pursue their interest may have been introduced to computer science too late. The younger, the better, Ms. Margolis says. Games would offer considerable promise, except that they have been tried and have failed to have an effect on steeply declining female enrollment.
But I couldn’t agree more with the sentiment with regard to age. I know of two all-girls schools (Miss Porter’s in Connecticut and Nightingale-Bamford in New York) who have used Processing in courses with high school and middle school students, and I couldn’t be more excited about it. Let’s hope there are more.

