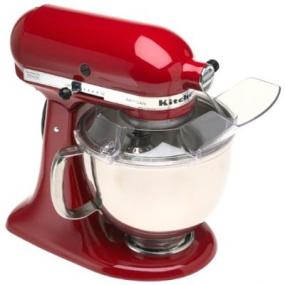
Wet and Dry Ingredients; Mixing Bowls and Baking Dishes
 Digging through my reading list pile, I begin skimming through A Box, Darkly: Obfuscation, Weird Languages, and Code Aesthetics by Michael Mateas and Nick Montfort. I was moving along pretty good until I reached the description of the Chef programming language:
Another language, Chef, illustrates different design decisions for structuring play. Chef facilities double-coding programs as recipes. Variables are declared in an ingredients list, with amounts indicating the initial value (e.g., 114 g of red salmon). The type of measurement determines whether an ingredient is wet or dry; wet ingredients are output as characters, dry ingredients are output as numbers. Two types of memory are provided, mixing bowls and baking dishes. Mixing bowls hold ingredients which are still being manipulated, while baking dishes hold collections of ingredients to output. What makes Chef particularly interesting is that all operations have a sensible interpretation as a step in a food recipe. Where Shakespeare programs parody Shakespearean plays, and often contain dialog that doesn’t work as dialog in a play (“you are as hard as the sum of yourself and a stone wall”), it is possible to write programs in Chef that might reasonably be carried out as a recipe. Chef recipes do have the unfortunate tendency to produce huge quantities of food, however, particularly because the sous-chef may be asked to produce sub-recipes, such as sauces, in a loop.
Wonderful. (And a nice break for someone who has been fretting about languages and syntax over the last couple weeks.)

