
Restoring Sight with the Tongue
 Visualization works because our eyes are the highest bandwidth channel for getting information into our brains. Researchers working to restore sight have found that the second best place may be the the tongue, due to the high density of nerve endings. An amazing testament to the adaptability of the brain to begin perceiving visual/spatial information from sensors of another organ.
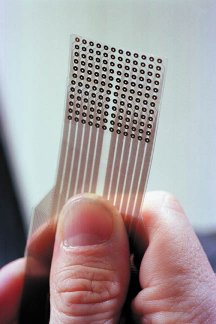
Researchers at the University of Wisconsin-Madison are developing this tongue-stimulating system, which translates images detected by a camera into a pattern of electric pulses that trigger touch receptors. The scientists say that volunteers testing the prototype soon lose awareness of on-the-tongue sensations. They then perceive the stimulation as shapes and features in space. Their tongue becomes a surrogate eye.
Earlier research had used the skin as a route for images to reach the nervous system. That people can decode nerve pulses as visual information when they come from sources other than the eyes shows how adaptable, or plastic, the brain is, says Wisconsin neuroscientist and physician Paul Bach-y-Rita, one of the device’s inventors.
Via mailing list post from Daniel Brown.
