Conveying multiple realities in research and journalism
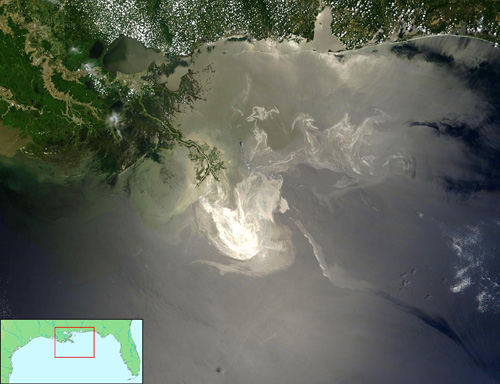
A recent Boston Globe editorial covers the issue of multiple, seemingly (if obviously) contradictory statements that come from complex research, in this case around the oil spill:
Last week, Woods Hole researchers reported a 22-mile-long underwater plume that they mapped out in the Gulf of Mexico in June — a finding indicating that much more oil may lie deep underwater and be degrading so slowly that it might affect the ecosystem for some time. Also last week, University of Georgia researchers estimated up to 80 percent of the spill may still be at large, with University of South Florida researchers finding poisoned plankton between 900 feet and 3,300 feet deep. This differed from the Aug. 4 proclamation by Administrator Jane Lubchenco of the National Oceanic and Atmospheric Administration that three-quarters of the oil was “completely gone’’ or dispersed and the remaining quarter was “degrading rapidly.’’
But then comes the Lawrence Berkeley National Laboratory, which this week said a previously unclassified species of microbes is wolfing down the oil with amazing speed. This means that all the scientists could be right, with massive plumes being decimated these past two months by an unexpected cleanup crew from the deep.
This is often the case for anything remotely complex: the opacity of the research process to the general public, the communication skills of various institutions, the differing perspective between what the public cares about (whose fault is it? how bad is it?) versus the interests of the researchers, and so on.
It’s a basic issue around communicating complex ideas, and therefore affects visualization too — it’s rare that there’s a single answer.
On a more subjective note, I don’t know if I agree with the premise of the editorial is that it’s on the government to sort out the mess for the public. It’s certainly a role of the government, though the sniping at the Obama administration makes the editorial writer sound one who is equally likely to bemoan government spending, size, etc. But I could write an equally (perhaps more) compelling editorial making the point that it’s actually the role of newspapers like the Globe to sort out newsworthy issues that concern the public. But sadly, the Globe, or at least the front page of boston.com, has been overly obsessed with more click-ready topics like the Craigslist killer (or any other rapist, murderer, or stomach-turning story involving children du jour) and playing “gotcha” with spending and taxes for universities and public officials. What a bunch of ghouls.
(Thanks to my mother-in-law for the article link.)


