Already checked it in Photoshop, so you don’t have to
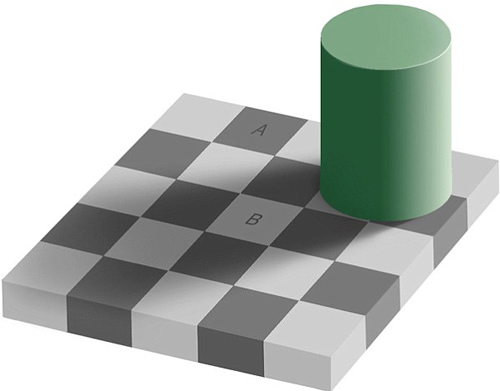
I wasn’t going to post this one, but I can’t get it out of my head. In the image below, the squares marked A and B are the same shade of gray.
The image is from Edward H. Adelson at MIT, and you can find my original source here. More details (proof, etc) on Adelson’s site here, which includes this explanation:
The visual system needs to determine the color of objects in the world. In this case the problem is to determine the gray shade of the checks on the floor. Just measuring the light coming from a surface (the luminance) is not enough: a cast shadow will dim a surface, so that a white surface in shadow may be reflecting less light than a black surface in full light. The visual system uses several tricks to determine where the shadows are and how to compensate for them, in order to determine the shade of gray “paint” that belongs to the surface.
The first trick is based on local contrast. In shadow or not, a check that is lighter than its neighboring checks is probably lighter than average, and vice versa. In the figure, the light check in shadow is surrounded by darker checks. Thus, even though the check is physically dark, it is light when compared to its neighbors. The dark checks outside the shadow, conversely, are surrounded by lighter checks, so they look dark by comparison.
A second trick is based on the fact that shadows often have soft edges, while paint boundaries (like the checks) often have sharp edges. The visual system tends to ignore gradual changes in light level, so that it can determine the color of the surfaces without being misled by shadows. In this figure, the shadow looks like a shadow, both because it is fuzzy and because the shadow casting object is visible.
The “paintness” of the checks is aided by the form of the “X-junctions” formed by 4 abutting checks. This type of junction is usually a signal that all the edges should be interpreted as changes in surface color rather than in terms of shadows or lighting.
As with many so-called illusions, this effect really demonstrates the success rather than the failure of the visual system. The visual system is not very good at being a physical light meter, but that is not its purpose. The important task is to break the image information down into meaningful components, and thereby perceive the nature of the objects in view.
(Like the earlier illusion post, this one’s also from my mother-in-law, who should apparently be writing this blog instead of its current—woefully negligent—author.)


