Writing

Processing + Eclipse

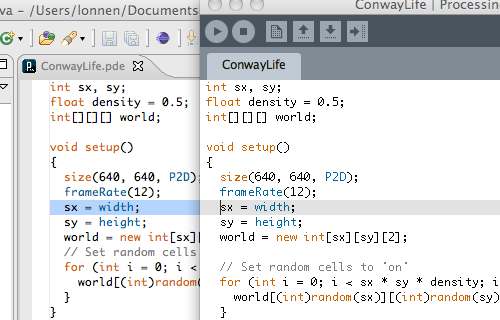
Exciting news! The short story is that there’s a new Processing Plug-in for Eclipse, and you can learn about it here.

twins!

The long story is that Chris Lonnen contacted me in the spring about applying for the Google Summer of Code (SoC) program, which I promptly missed the deadline for. But we eventually managed to put him to work anyway, via Fathom (our own SoC army of one, with Chris working from afar in western New York) with the task of working on a new editor that we can use to replace the current Processing Development Environment (the PDE).

After some initial work and scoping things out, we settled on the Eclipse RCP as the platform, with the task of first making a plug-in that works in the Eclipse environment (everything in Eclipse is a plug-in), which could then eventually become its own standalone editor to replace the current PDE.

Things are currently incomplete (again, see the Wiki page for more details), but give it a shot, file bugs (tag with Component-Eclipse when filing), and help lend Chris a hand in developing it further. Or if you have questions, be sure to use the forum. Come to think of it, might be time for a new forum section…

Tuesday, October 19, 2010 | processing  
Book

Visualizing Data Book CoverVisualizing Data is my 2007 book about computational information design. It covers the path from raw data to how we understand it, detailing how to begin with a set of numbers and produce images or software that lets you view and interact with information. When first published, it was the only book(s) for people who wanted to learn how to actually build a data visualization in code.

The text was published by O’Reilly in December 2007 and can be found at Amazon and elsewhere. Amazon also has an edition for the Kindle, for people who aren’t into the dead tree thing. (Proceeds from Amazon links found on this page are used to pay my web hosting bill.)

Examples for the book can be found here.

The book covers ideas found in my Ph.D. dissertation, which is the basis for Chapter 1. The next chapter is an extremely brief introduction to Processing, which is used for the examples. Next is (chapter 3) is a simple mapping project to place data points on a map of the United States. Of course, the idea is not that lots of people want to visualize data for each of 50 states. Instead, it’s a jumping off point for learning how to lay out data spatially.

The chapters that follow cover six more projects, such as salary vs. performance (Chapter 5), zipdecode (Chapter 6), followed by more advanced topics dealing with trees, treemaps, hierarchies, and recursion (Chapter 7), plus graphs and networks (Chapter 8).

This site is used for follow-up code and writing about related topics.