
Can we just agree never to use the word “surge”… in any context?
Somewhere between the “most important” and “only useful” thing about the wide availability map data, GPS systems, and the sort 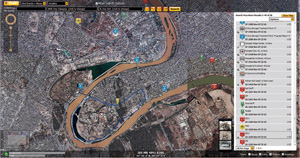 of mash-up type things that are all the rage is the ability to actually annotate map information in a useful way by combining these features.
An unfortunately titled article from the Technology Review describes a system being used in Iraq to help soldiers with their counterinsurgency efforts.
The new technology … is a map-centric application that … officers … can study before going on patrol and add to upon returning. By clicking on icons and lists, they can see the locations of key buildings, like mosques, schools, and hospitals, and retrieve information such as location data on past attacks, geotagged photos of houses and other buildings (taken with [GPS-equipped] cameras), and photos of suspected insurgents and neighborhood leaders. They can even listen to civilian interviews and watch videos of past maneuvers. It is just the kind of information that soldiers need to learn about Iraq and its perils.
It’s a wonder that such systems aren’t the norm, and the software described seems quite straightforward. But a step further, I found this quote intriguing:
“It is a bit revolutionary from a military perspective when you think about it, using peer-based information to drive the next move … Normally we are used to our higher headquarters telling the patrol leader what he needs to think.”
Not so much the cliché of technology being an enabler or democratizer (that can’t be a word, can it?) Rather, there’s something interesting about how the strength of a military structure (in discipline and rote effectiveness) is derived in part from top-down control, but that lies in direct contradiction to how information—of any kind, really—needs to move around this organization for it to be effective. What does it mean an approach like this one works in such contrast to tradition?
