Collections for Charity
 Last week at the CaT conference, I met Sheena Matheiken, a designer who is … I’ll let her explain:
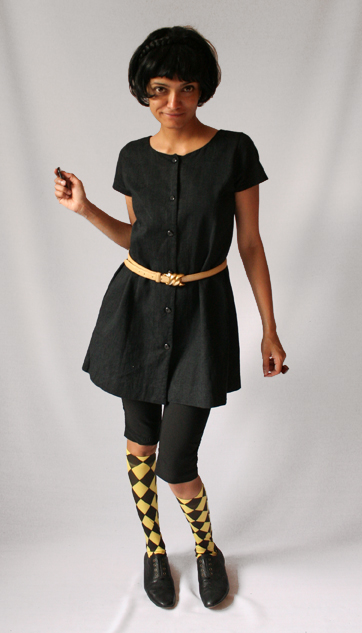
Starting May 2009, I have pledged to wear one dress for one year as an exercise in sustainable fashion. Here’s how it works: There are 7 identical dresses, one for each day of the week. Every day I will reinvent the dress with layers, accessories and all kinds of accouterments, the majority of which will be vintage, hand-made, or hand-me-down goodies. Think of it as wearing a daily uniform with enough creative license to make it look like I just crawled out of the Marquis de Sade’s boudoir.
Interesting, right? Particularly where the idea is to make the outfit new through the sort of forced creativity that comes from wearing a uniform. But also not unlike the dozens (hundreds? thousands?) of other “I’m gonna do x each day for 365 days” projects, where obsessive compulsive types take a photo, choose a Pantone swatch, learn a new word, etc. in celebration of the Earth revolving about its axis once more. Yale’s graduate graphic design program even frequents a yearly “100 day” project along these lines. (Don’t get me wrong–I’m happy to obsess and compulse with the best of them.)
But then it gets more interesting:
The Uniform Project is also a year-long fundraiser for the Akanksha Foundation, a grassroots movement that is revolutionizing education in India. At the end of the year, all contributions will go toward Akanksha’s School Project to fund uniforms and other educational expenses for slum children in India.
How cool! I love how this ties the project together. More can be found at The Uniform Project, with daily photos of Sheena’s progress. And be sure to donate.
I’m looking forward to what she has to say about what she’s learned about clothes and how you wear them after the year is complete. Ironic, that the year she wears the same thing for 365 days will be her most creative.

