Shirts with Zips
Got a note during SXSW from Marc Cull at CafePress to tell me that they were doing real-time order visualization using an adaptation of zipdecode (explained in Visualizing Data). Fun! Gave me a giggle, at any rate:


Got a note during SXSW from Marc Cull at CafePress to tell me that they were doing real-time order visualization using an adaptation of zipdecode (explained in Visualizing Data). Fun! Gave me a giggle, at any rate:
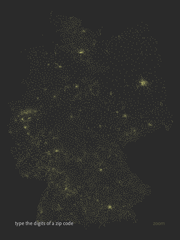 Maximillian Dornseif has adapted Zipdecode from Chapter 6 of Visualizing Data to handle German postal codes. I’ve wanted to do this myself since hearing about the OpenGeoDB data set which includes the data, but thankfully he’s taken care of it first and is sharing it with the rest of us along with his modified code.
(The site is in German…I’ll trust any of you German readers to let me know if the site actually says that Visualizing Data is the dumbest book he’s ever read.)
Also helpful to note that he used Python for preprocessing the data. He doesn’t bother implementing a map projection, as done in the book, but the Python code is a useful example of using another language when appropriate, and how the syntax differs from Processing:
# Convert opengeodb data for zipdecode
fd = open('PLZ.tab')
out = []
minlat = minlon = 180
maxlat = maxlon = 0

for line in fd:
    line = line.strip()
    if not line or line.startswith('#'):
        continue
    parts = line.split('\t')
    dummy, plz, lat, lon, name = parts
    out.append([plz, lat, lon, name])
    minlat = min([float(lat), minlat])
    minlon = min([float(lon), minlon])
    maxlat = max([float(lat), maxlat])
    maxlon = max([float(lon), maxlon])

print "# %d,%f,%f,%f,%f" % (len(out), minlat, maxlat, minlon, maxlon)
for data in out:
    plz, lat, lon, name = data
    print '\t'.join([plz, str(float(lat)), str(float(lon)), name])
In the book, I used Processing for most of the examples (with a little bit of Perl) for sake of simplicity. (The book is already introducing a lot of new material, why hurt people and introduce multiple languages while I’m at it?) However that’s one place where the book diverges from my own process a bit, since I tend to use a lot of Perl when dealing with large volumes of text data. Python is also a good choice (or Ruby if that’s your thing), but I’m tainted since I learned Perl first, while a wee intern at Sun.
 Dominic Allemann has developed a Swiss version of the zipdecode example from chapter six of Visualizing Data. This is the whole point of the book—to actually try things out and adapt them in different ways and see what you can learn from it.
Switzerland makes an interesting example because it has far fewer postal codes than the U.S., though the dots are quite elegant on their own. With fewer data points, I’d be inclined to 1) change the size of the individual points to make them larger without making them overwhelming, 2) or work with the colors to make the contrast more striking, since changing the point size is likely to be too much), and 3) get the text into mixed case (in this example, Gossau SG instead of GOSSAU SG). Something as minor as avoiding ALL CAPS helps get us away from the representation looking too much like COMPUTERS and DATABASES, and instead into something meant for regular humans. Finally, 4) with the smaller (and far more regular) data set, it’s not clear if the zoom even helps—could even be better off without it.
Thanks to Dominic for passing this along; it’s great to see!
 Visualizing Data is my 2007 book about computational information design. It covers the path from raw data to how we understand it, detailing how to begin with a set of numbers and produce images or software that lets you view and interact with information. When first published, it was the only book(s) for people who wanted to learn how to actually build a data visualization in code.
The text was published by O’Reilly in December 2007 and can be found at Amazon and elsewhere. Amazon also has an edition for the Kindle, for people who aren’t into the dead tree thing. (Proceeds from Amazon links found on this page are used to pay my web hosting bill.)
Examples for the book can be found here.
The book covers ideas found in my Ph.D. dissertation, which is the basis for Chapter 1. The next chapter is an extremely brief introduction to Processing, which is used for the examples. Next is (chapter 3) is a simple mapping project to place data points on a map of the United States. Of course, the idea is not that lots of people want to visualize data for each of 50 states. Instead, it’s a jumping off point for learning how to lay out data spatially.
The chapters that follow cover six more projects, such as salary vs. performance (Chapter 5), zipdecode (Chapter 6), followed by more advanced topics dealing with trees, treemaps, hierarchies, and recursion (Chapter 7), plus graphs and networks (Chapter 8).
This site is used for follow-up code and writing about related topics.