Writing

Matthew Carter wins a MacArthur

I’m really happy to see typographer Matthew Carter receive a well-deserved MacArthur “Genius” Grant. A short video:

Very well put:

I think they’re saying to me, “You’ve done all this work. Well done… Here’s an award, now do more. Do better.” And it’s very nice, at my age, to be told by someone, that “we expect more from you. And here’s the means to help you achieve that.”

And if you’re not familiar with Carter’s name, you know his work: he created both Verdana and Georgia, at least one of which will be found on nearly any web site (the text you’re reading now is Georgia). Microsoft’s commission of these web fonts helped improve design on the web significantly in the mid-to-late 90s. Carter also developed several other important typefaces like Bell Centennial (back in the 70s), the tiny text found in phone books.

Tuesday, September 28, 2010 | typography  

Weight Duplexing, Condensed Tabulars, and Multiple Enclosures

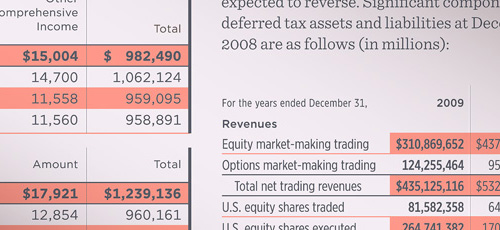
More typographic tastiness (see the earlier post) from Hoefler & Frere-Jones with a writeup on Choosing Fonts for Annual Reports. Lots of useful design help and ideas for anyone who works with numbers, whether actual annual reports or (more likely) fighting with Excel and PowerPoint. For instance, using enclosures to frame numbers, or knock them out:

knocking out heaven's door

Another helpful trick is using two weights so that you can avoid placing a line between them:

pick em out of a lineup

Or using a proper condensed face when you have to invite too many of your numerical friends:

squeeze me macaroni

At any rate, I recommend the full article for anyone working with numbers, either for the introduction to setting type (for the non-designers) or a useful reminder of some of the solutions (for those who fret about these things on a regular basis).

Thursday, August 6, 2009 | refine, typography  

“…the sexiest numbers I’ve seen in some time.”

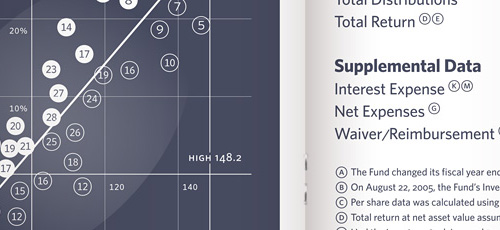
A Fonts for Financials mailing from Hoefler & Frere-Jones includes some incredibly beautiful typefaces they’ve developed that play well with numbers. A sampling includes tabular figures (monospaced numbers, meaning “farewell, Courier!”) using Gotham and Sentinel:

courier and andale mono can bite me

Or setting indices (numbers in circles, apparently), using Whitney:

numbers, dots, dots, numbers

As Casey wrote this morning, “these are the sexiest numbers I’ve seen in some time.” I love ’em.

Tuesday, July 21, 2009 | typography  

Evolution of the Super Bowl Logo

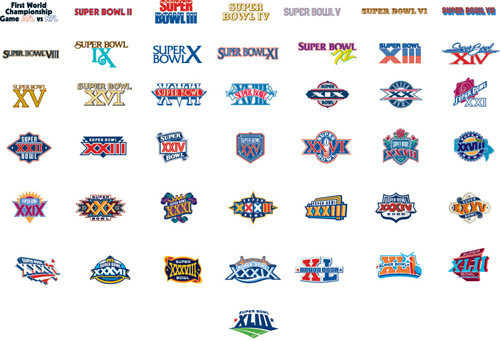
From The New York Times, a collection of all 43 logos used to advertise the Super Bowl:

super bowl logos over time

The original article cites how the logos reflect the evolution and growth of the league. Which makes sense, you can see that it was more than fifteen years before it moved from just a logotype to a fully branded extravaganza. Or that in its first year it wasn’t the Super Bowl at all, and instead billed as “The First World Championship Game of the American Football Conference versus the National Football Conference,” a title that sounds great in a late-60s broadcaster voice (try it, you’ll like it), but was still shortened to the neanderthal “First World World Championship Game AFC vs NFC” for the logo, before it was renamed the “Super Bowl” the following year. (You can stop repeating the name in the broadcaster voice now, your officemates are getting annoyed.)

The similarities in the coloring are perhaps more interesting than the differences, though the general Americana obsession of the constant blue/red coloring is unsurprising, especially when you recall that some of the biggest perennial ad buyers (Coke, Pepsi, Budweiser) also share red, white, and blue labels. I’m guessing that the heavy use of yellow in the earlier logos had more to do with yellow looking good against a background when used for broadcast.

Or maybe not — like any good collection, there’s plenty to speculate about and many hypotheses to be drawn — and the investigation is more interesting for the exercise.

Monday, February 2, 2009 | collections, football, sports, time, typography  

Did Forbes just write an article about a font?

Via this Slate article from Farhad Manjoo (writer of tech-hype articles with Salon and now Slate), I just read about Droid, the typeface used in Google’s new Android phones. More specifically, he references this Forbes article, describing the background of the font, and its creator, Steve Matteson of Ascender Corporation in Elk Grove, Illinois.

Some background from the Forbes piece:

In fonts, Google has a predilection for cute letters and bright primary colors, as showcased in the company’s own logo. But for Android Google wanted a font with “common appeal,” Davis says. Ascender’s chief type designer, Steve Matteson, who created the Droid fonts, says Google requested a design that was friendly and approachable. “They wanted to see a range of styles, from the typical, bubbly Google image to something very techno-looking,” Matteson says.

droidfont_426x100.jpg

The sweet spot—and the final look for Droid—fell somewhere in the middle. Matteson’s first design was “bouncy”: a look in line with the Google logo’s angled lowercase “e.” Google passed on the design because it was “a little too mannered,” Matteson says. “There was a fine line between wanting the font to have character but not cause too much commotion.”

Another proposal erred on the side of “techno” with squared-off edges reminiscent of early computer typefaces. That too was rejected, along with several others, in favor of a more neutral design that Matteson describes as “upright with open forms, but not so neutral as a design like, say, Helvetica.”

I haven’t had a chance to play with an Android phone (as much as I’ve been happy with T-Mobile, particularly their customer service, do I re-up with them for two years just to throw money at alpha hardware?) so I can’t say much about the face, but I find the font angle fascinating, particular in light of Apple’s Helvetica-crazy iPhone and iPod Touch. (Nothing says late 1950s Switzerland quite like a touch-screen interface mobile phone, after all.)

Ascender Corporation also seems to be connected to the hideously named C@#$(*$ fonts found in Windows Vista and Office 2007: Calibri, Cambria, Candara, Consolas, Constantia, Corbel, Cariadings. In the past several years, Microsoft has shown a notable and impressive commitment to typography (most notably, hiring Matthew Carter to create Verdana, and other decisions of that era), but the new C* fonts have that same air of creepiness of a family who names all their kids with names that start with the same letter. I mean sure, they’re terrific people, but man, isn’t that just a little…unnecessary?

Monday, November 17, 2008 | mobile, typography  

Typography Grab Bag: Berlow, Carter, and Indiana Jones

raiders.jpgIndiana Jones and the Fonts on the Maps – Mark Simonson takes on historical accuracy of the typography used in the Indiana Jones movies:

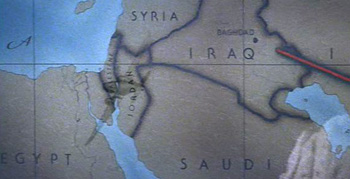
For the most part, the type usage in each of the movies is correct for the period depicted. With one exception: The maps used in the travel montages.

My theory is that this is because the travel maps are produced completely outside the standard production team. They’re done by some motion graphics house, outside the purview of the people on-set who are charged with issues of consistency. A nastier version of this theory might indict folks who do motion graphics for not knowing their typography and its time period—instead relying on the “feel” of the type when selecting. The bland version of this theory is that type history is esoteric, and nobody truly cares.

(Also a good time to point out how maps are used as a narrative device in the film, to great effect. The red line extending across the map is part of the Indiana Jones brand. I’d be curious to hear the story behind the mapping—who decided it needed to be there, who made it happen, who said “let’s do a moving red line that tracks the progress”—which parts were intentional, and which unintentional.)

Identifying the period for the faces reminded me of a 2005 profile of Matthew Carter, which described his involvement in court cases where date was in doubt, but typography of artifacts in question gave away their era. Sadly the article cannot be procured from the web site of The New Yorker, though you may have better luck if you possess a library card. Matthew Carter designed the typefaces Verdana and Bell Centennial (among many others). Spotting his wispy white ponytail around Harvard Square is a bit like seeing a rock star, if you’re a Cantabridgian typography geek.

From A to Z, font designer knows his type – a Boston Globe interview with type designer David Berlow (one of the founders of Font Bureau), some of the questions are unfortunate, but a few interesting anecdotes:

Playboy magazine came to me; they were printing with two printing processes, offset and gravure. Gravure (printing directly from cylinder to paper), gives a richer, smoother texture when printing flesh tones and makes the type look darker on the page than offset (indirect image transfer from plates). So if you want the type to look the same, you have to use two fonts. We developed two fonts for Playboy, but they kept complaining that the type was still coming out too dark or too light. Finally, I got a note attached to a proof that said, “Sorry. It was me. I needed new glasses. Thanks for all your help. Hef.” That was Hugh Hefner, of course.

Or speaking about his office:

From Oakland, Calif., to Delft, Holland, all the designers work from home. I have never been to the office. The first time I saw it was when I watched the documentary “Helvetica,” which showed our offices.
fontstruct-screenshot-300.jpg

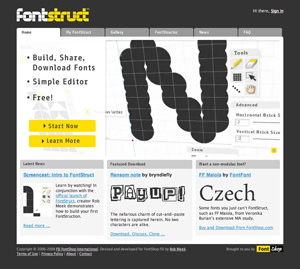
The strange allure of making your own fonts – Jason Fagone describes FontStruct, a web-based font design tool from FontShop:

FontStruct’s interface couldn’t be more intuitive. The central metaphor is a sheet of paper. You draw letters on the “sheet” using a set of standard paint tools (pencil, line, box, eraser) and a library of what FontStruct calls “bricks” (squares, circles, half-circles, crescents, triangles, stars). If you keep at it and complete an entire alphabet, FontStruct will package your letters into a TrueType file that you can download and plunk into your PC’s font folder. And if you’re feeling generous, you can tell FontStruct to share your font with everybody else on the Internet under a Creative Commons license. Every font has its own comment page, which tends to fill with praise, practical advice, or just general expressions of devotion to FontStruct.

Though I think my favorite bit might be this one:

But the vast majority of FontStruct users aren’t professional designers, just enthusiastic font geeks.

I know that because I’m one of them. FontStruct brings back a ton of memories; in college, I used to run my own free-font site called Alphabet Soup, where I uploaded cheapie fonts I made with a pirated version of a $300 program called Fontographer. Even today, when I self-Google, I mostly come up with links to my old, crappy fonts. (My secret fear is that no matter what I do as a reporter, the Monko family of fonts will remain my most durable legacy.)

The proliferation of bad typefaces: the true cost of software piracy.

Tuesday, June 17, 2008 | grabbag, mapping, refine, software, typography  
Book

Visualizing Data Book CoverVisualizing Data is my 2007 book about computational information design. It covers the path from raw data to how we understand it, detailing how to begin with a set of numbers and produce images or software that lets you view and interact with information. When first published, it was the only book(s) for people who wanted to learn how to actually build a data visualization in code.

The text was published by O’Reilly in December 2007 and can be found at Amazon and elsewhere. Amazon also has an edition for the Kindle, for people who aren’t into the dead tree thing. (Proceeds from Amazon links found on this page are used to pay my web hosting bill.)

Examples for the book can be found here.

The book covers ideas found in my Ph.D. dissertation, which is the basis for Chapter 1. The next chapter is an extremely brief introduction to Processing, which is used for the examples. Next is (chapter 3) is a simple mapping project to place data points on a map of the United States. Of course, the idea is not that lots of people want to visualize data for each of 50 states. Instead, it’s a jumping off point for learning how to lay out data spatially.

The chapters that follow cover six more projects, such as salary vs. performance (Chapter 5), zipdecode (Chapter 6), followed by more advanced topics dealing with trees, treemaps, hierarchies, and recursion (Chapter 7), plus graphs and networks (Chapter 8).

This site is used for follow-up code and writing about related topics.