Writing

Distribution of the foreign customers at a particular youth hostel

Two pieces representing youth hostel data from Julien Bayle. Both adaptations of the code found in Visualizing Data. The first a map:

bayle-worldmap.jpg

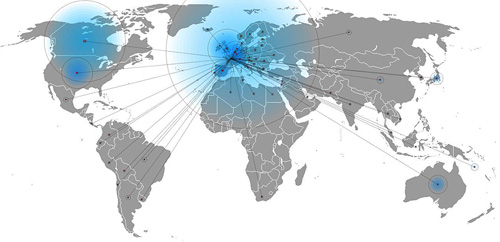
The map looks like most maps of data connected to a world map, but the second representation uses a treemap, which is much more effective (meaning that it answers his question much more directly).

bayle-treemap.jpg

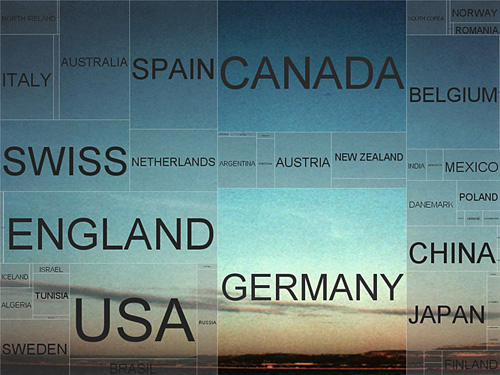
The image as background is a nice technique, since if you’re not using colors to differentiate individual sectors, the treemap tends to be dominated by the outlines around the squares (search for treemap images and you’ll see what I mean). The background image lets you use the border lines, but the visual weight of the image prevents them from being in the foreground.

Anyone else with adaptations? Pass them along.

Thursday, June 5, 2008 | adaptation, vida  
Book

Visualizing Data Book CoverVisualizing Data is my 2007 book about computational information design. It covers the path from raw data to how we understand it, detailing how to begin with a set of numbers and produce images or software that lets you view and interact with information. When first published, it was the only book(s) for people who wanted to learn how to actually build a data visualization in code.

The text was published by O’Reilly in December 2007 and can be found at Amazon and elsewhere. Amazon also has an edition for the Kindle, for people who aren’t into the dead tree thing. (Proceeds from Amazon links found on this page are used to pay my web hosting bill.)

Examples for the book can be found here.

The book covers ideas found in my Ph.D. dissertation, which is the basis for Chapter 1. The next chapter is an extremely brief introduction to Processing, which is used for the examples. Next is (chapter 3) is a simple mapping project to place data points on a map of the United States. Of course, the idea is not that lots of people want to visualize data for each of 50 states. Instead, it’s a jumping off point for learning how to lay out data spatially.

The chapters that follow cover six more projects, such as salary vs. performance (Chapter 5), zipdecode (Chapter 6), followed by more advanced topics dealing with trees, treemaps, hierarchies, and recursion (Chapter 7), plus graphs and networks (Chapter 8).

This site is used for follow-up code and writing about related topics.