Surfing, Orgies, and Apple Pie
Obscenity law in the United States is based on Miller vs. California, a precedent set in 1973:
“(a) whether the ‘average person, applying contemporary community standards’ would find that the work, taken as a whole, appeals to the prurient interest,
(b) whether the work depicts or describes, in a patently offensive way, sexual conduct specifically defined by the applicable state law, and
(c) whether the work, taken as a whole, lacks serious literary, artistic, political, or scientific value.”
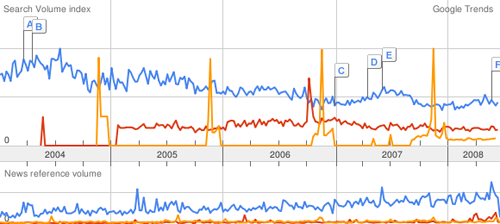
Of course, the definition of an average person or community standards isn’t quite as black and white as most Supreme Court decisions. In a new take, the lawyer defending the owner of a pornography site in Florida is using Google Trends to produce what he feels is a more accurate definition of community standards:
In the trial of a pornographic Web site operator, the defense plans to show that residents of Pensacola are more likely to use Google to search for terms like “orgy” than for “apple pie” or “watermelon.” The publicly accessible data is vague in that it does not specify how many people are searching for the terms, just their relative popularity over time. But the defense lawyer, Lawrence Walters, is arguing that the evidence is sufficient to demonstrate that interest in the sexual subjects exceeds that of more mainstream topics — and that by extension, the sexual material distributed by his client is not outside the norm.
Below, “surfing” in blue, “orgy” in red, and “apple pie” in orange:
A clever defense. The trends can also be localized to roughly the size of a large city or county, which arguably might be considered the “community.” The New York Times article continues:
“Time and time again you’ll have jurors sitting on a jury panel who will condemn material that they routinely consume in private,” said Mr. Walters, the defense lawyer. Using the Internet data, “we can show how people really think and feel and act in their own homes, which, parenthetically, is where this material was intended to be viewed,” he added.
Fascinating that there could actually be something even remotely quantifiable about community standards. “I know it when I see it” is inherently subjective, so is any introduction of objectivity an improvement? For more perspective, I recommend this article from FindLaw, which describes the history of “Movie Day” at the Supreme Court and the evolution of obscenity law.
The trends data has many inherent problems (lack of detail for one), but is another indicator of what we can learn from Google. Most important to me, the case provides an example of what it means for search engines to capture this information, because it demonstrates to the public at large (not just people who think about data all day) how the information can be used. As more information is collected about us, search engine data provides an imperfect mirror onto our society, previously known only to psychiatrists and priests.


