Writing

Surfing, Orgies, and Apple Pie

Obscenity law in the United States is based on Miller vs. California, a precedent set in 1973:

“(a) whether the ‘average person, applying contemporary community standards’ would find that the work, taken as a whole, appeals to the prurient interest,

(b) whether the work depicts or describes, in a patently offensive way, sexual conduct specifically defined by the applicable state law, and

(c) whether the work, taken as a whole, lacks serious literary, artistic, political, or scientific value.”

Of course, the definition of an average person or community standards isn’t quite as black and white as most Supreme Court decisions. In a new take, the lawyer defending the owner of a pornography site in Florida is using Google Trends to produce what he feels is a more accurate definition of community standards:

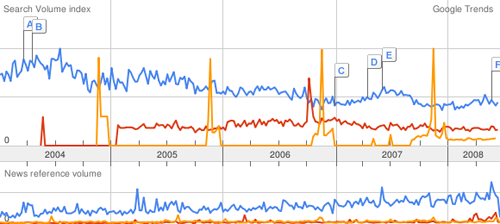
In the trial of a pornographic Web site operator, the defense plans to show that residents of Pensacola are more likely to use Google to search for terms like “orgy” than for “apple pie” or “watermelon.” The publicly accessible data is vague in that it does not specify how many people are searching for the terms, just their relative popularity over time. But the defense lawyer, Lawrence Walters, is arguing that the evidence is sufficient to demonstrate that interest in the sexual subjects exceeds that of more mainstream topics — and that by extension, the sexual material distributed by his client is not outside the norm.

Below, “surfing” in blue, “orgy” in red, and “apple pie” in orange:

viz-500.png

A clever defense. The trends can also be localized to roughly the size of a large city or county, which arguably might be considered the “community.” The New York Times article continues:

“Time and time again you’ll have jurors sitting on a jury panel who will condemn material that they routinely consume in private,” said Mr. Walters, the defense lawyer. Using the Internet data, “we can show how people really think and feel and act in their own homes, which, parenthetically, is where this material was intended to be viewed,” he added.

Fascinating that there could actually be something even remotely quantifiable about community standards. “I know it when I see it” is inherently subjective, so is any introduction of objectivity an improvement? For more perspective, I recommend this article from FindLaw, which describes the history of “Movie Day” at the Supreme Court and the evolution of obscenity law.

The trends data has many inherent problems (lack of detail for one), but is another indicator of what we can learn from Google. Most important to me, the case provides an example of what it means for search engines to capture this information, because it demonstrates to the public at large (not just people who think about data all day) how the information can be used. As more information is collected about us, search engine data provides an imperfect mirror onto our society, previously known only to psychiatrists and priests.

Tuesday, June 24, 2008 | online, privacy, retention, social  

Somewhere between graffiti and terrorism

boy-noshadow.jpgMatt Mullenweg, creator of WordPress, speaking at the “Future of Web Apps” conference in February:

Spammers are “the terrorists of Web 2.0,” Mullenweg said. “They come into our communities and take advantage of our openness.” He suggested that people may have moved away from e-mail and toward messaging systems like Facebook messaging and Twitter to get away from spam. But with all those “zombie bites” showing up in his Facebook in-box, he explained, the spammers are pouncing on openness once again.

I don’t think that “terrorists” is the right word—they’re not taking actions with an intent to produce fear that will prevent people from using online communities (much less killing bloggers or kidnapping Facebook users). What I like about this quote is the idea that “they take advantage of openness,” which puts it well. There needs to be a harsher way to describe this situation than “spamming” which suggests a minor annoyance. There’s nothing like spending a Saturday morning cleaning out the Processing discussion board, or losing an afternoon modifying the bug database to keep it safer from these losers. It’s a bit like people who crack machines out of maliciousness or boredom—it’s incredibly time consuming to clean up the mess, and incredibly frustrating when it’s something done in your spare time (like Processing) or to help out the group (during grad school at the ACG).

So it’s somewhere between graffiti and terrorism, but it doesn’t match either because the social impact at either end of that scale is incredibly different (graffiti can be a positive thing, and terrorism is a real world thing where people die).

On a more positive note, and for what it’s worth, I highly recommend WordPress. It’s obvious that it’s been designed and built by people who actually use it, which means that the interface is pleasantly intuitive. And not surprising that it was initially created by such a character.

Monday, June 9, 2008 | online, social  
Book

Visualizing Data Book CoverVisualizing Data is my 2007 book about computational information design. It covers the path from raw data to how we understand it, detailing how to begin with a set of numbers and produce images or software that lets you view and interact with information. When first published, it was the only book(s) for people who wanted to learn how to actually build a data visualization in code.

The text was published by O’Reilly in December 2007 and can be found at Amazon and elsewhere. Amazon also has an edition for the Kindle, for people who aren’t into the dead tree thing. (Proceeds from Amazon links found on this page are used to pay my web hosting bill.)

Examples for the book can be found here.

The book covers ideas found in my Ph.D. dissertation, which is the basis for Chapter 1. The next chapter is an extremely brief introduction to Processing, which is used for the examples. Next is (chapter 3) is a simple mapping project to place data points on a map of the United States. Of course, the idea is not that lots of people want to visualize data for each of 50 states. Instead, it’s a jumping off point for learning how to lay out data spatially.

The chapters that follow cover six more projects, such as salary vs. performance (Chapter 5), zipdecode (Chapter 6), followed by more advanced topics dealing with trees, treemaps, hierarchies, and recursion (Chapter 7), plus graphs and networks (Chapter 8).

This site is used for follow-up code and writing about related topics.