Watching the evolution of the “Origin of Species”
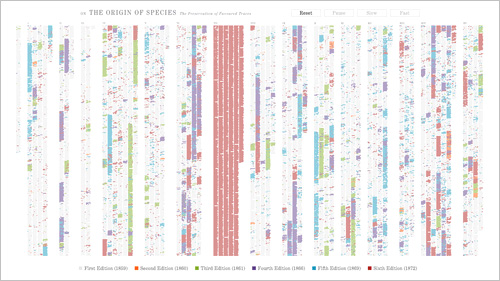
I’ve just posted a new piece that depicts changes between the multiple editions of Darwin’s “On the Origin of Species:
To quote myself, because it looks important:
We often think of scientific ideas, such as Darwin’s theory of evolution, as fixed notions that are accepted as finished. In fact, Darwin’s On the Origin of Species evolved over the course of several editions he wrote, edited, and updated during his lifetime. The first English edition was approximately 150,000 words and the sixth is a much larger 190,000 words. In the changes are refinements and shifts in ideas — whether increasing the weight of a statement, adding details, or even a change in the idea itself.
The idea that we can actually see change over time in a person’s thinking is fascinating. Darwin scholars are of course familiar with this story, but here we can view it directly, both on a macro-level as it animates, or word-by-word as we examine pieces of the text more closely.
This is hopefully the first of multiple pieces working with this data. Having worked with it since last December, I’ve been developing a larger application that deals with the information in a more sophisticated way, but that’s continually set aside because of other obligations. This simpler piece was developed for Emily King’s “Quick Quick Slow” exhibition opening next week at Experimenta Design in Portugal. As is often the case, many months were spent to try to create something monolithic, then in a very short time, an offshoot of all that work is developed that makes use of that infrastructure.
Oddly enough, I first became interested in this because of a discussion with a friend a few years ago, who had begun to wonder whether Darwin had stolen most of his better ideas from Alfred Russel Wallace, but gained the notoriety and credit because of his social status. (This appealed to the paranoid creator in me.) She cited the first edition of Darwin’s text as incoherent, and that it gradually improved over time. Interestingly (and happily, I suppose), the process of working on this piece has instead shown the opposite, and I have far greater appreciation for Darwin’s ideas than I had in the past.


