
All Streets
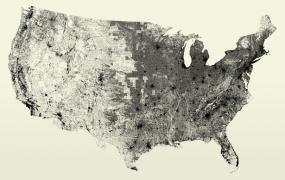 New work, now posted. All of the streets in the lower 48 United States: an image of 26 million individual road segments. This began as an example I created for one of my students in the fall of 2006, and I just recently got a chance to document it properly.
Nothing particularly genius about this piece—it’s mostly just a matter of collecting the data and creating the image. But it’s one of those cases where even in a (relatively) raw format, the data itself is quite striking.
The data in this piece comes from the U.S. Census Bureau’s TIGER/Line data files. The data is first parsed and filtered (to remove non-street features) using Perl. Next, using Processing, the latitude and longitude coordinates are transformed using an Albers equal-area conic projection (which gives it that curvy surface-of-the-Earth look that we’re used to), and then plotted to an enormous image that’s saved to the disk. The steps are similar to the preprocessing stages described in Chapter 6 of Visualizing Data.
I had originally hoped to use this piece to show patterns in street naming, but I didn’t manage to find as much as I had hoped. For instance, names of local trees and flowers being tied to the local geographic regions where they’re found. However, cookie cutter suburban neighborhood developments seem to have obliterated any causation. “Magnolia” is such a nice sounding, outdoorsy word; who wouldn’t want it adorning their street corner? Local flora be damned.
There are, however, a few other interesting tidbits in the data that I hope to cover in a future project. Real work be damned.
