Writing

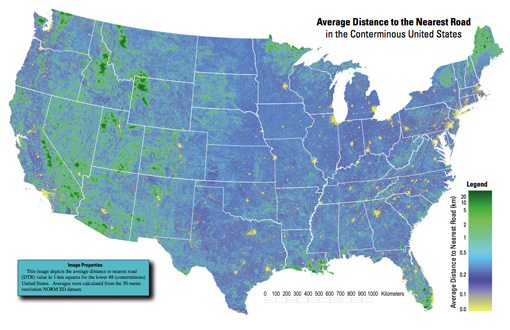
Average Distance to the Nearest Road in the Conterminous United States

Got an email over the weekend from Tom Vanderbilt, who had seen the All Streets piece, and was kind enough to point me to this map (PDF) from the USGS that depicts the average distance to the nearest road across the continental 48 states. (He’s currently working on a book titled Traffic: Why We Drive the Way We Do (and What It Says About Us) to be released this fall).

And too bad I just learned the word conterminous, but had I used that in the original project description, we would have missed (or been spared) the Metafilter discussion of whether “lower 48” was accurate terminology.

roadproximity2.jpg

A really interesting map, which of course also shows the difference between something thrown together in a few hours and actual research. In digging around for the map’s source, I found that exactly a year ago, they also published a paper in Science describing their broader work:

Roads encroaching into undeveloped areas generally degrade ecological and watershed conditions and simultaneously provide access to natural resources, land parcels for development, and recreation. A metric of roadless space is needed for monitoring the balance between these ecological costs and societal benefits. We introduce a metric, roadless volume (RV), which is derived from the calculated distance to the nearest road. RV is useful and integrable over scales ranging from local to national. The 2.1 million cubic kilometers of RV in the conterminous United States are distributed with extreme inhomogeneity among its counties.

The publication even includes a response and a response to the response—high scientific drama! Apparently some lads feel that “roadless volume does not explicitly address ecological processes.” So let that be a warning to all you non-explicit addressers.

For those lucky to have access to the journal online, the supplementary information includes a time lapse video of a section of Colorado, and its roadless volume since 1937. As with all things, it’s much more interesting to see how this changes over time. A map of all streets in the lower 48 isn’t nearly as engaging as a sequence of the same area over several years. The latter story is simply far more compelling.

Tuesday, May 6, 2008 | allstreets, feedbag, mapping  

All Streets Error Messages

Some favorite error messages while working on the All Streets project (mentioned below). I was initially hoping to use Illustrator to open the generated PDF files (generated from Processing), but Venus informed me that it was not to be:

illustrator-sucks-balls.png

I’m having difficulties as well. Why did I pay for this software?

Generally, Photoshop is far better engineered so I was hoping that it would be able to rasterize the PDF file instead, never mind the vectors and all.

photoshops-own-balls.png

Oh come on… Just admit that you ran out of memory and can’t deal. Meanwhile, Eugene was helping out with the site, from the other end of iChat:

aim-error-none.png

Oh well.

Sunday, April 27, 2008 | allstreets, software  

All Streets

all streetsNew work, now posted. All of the streets in the lower 48 United States: an image of 26 million individual road segments. This began as an example I created for one of my students in the fall of 2006, and I just recently got a chance to document it properly.

Nothing particularly genius about this piece—it’s mostly just a matter of collecting the data and creating the image. But it’s one of those cases where even in a (relatively) raw format, the data itself is quite striking.

The data in this piece comes from the U.S. Census Bureau’s TIGER/Line data files. The data is first parsed and filtered (to remove non-street features) using Perl. Next, using Processing, the latitude and longitude coordinates are transformed using an Albers equal-area conic projection (which gives it that curvy surface-of-the-Earth look that we’re used to), and then plotted to an enormous image that’s saved to the disk. The steps are similar to the preprocessing stages described in Chapter 6 of Visualizing Data.

I had originally hoped to use this piece to show patterns in street naming, but I didn’t manage to find as much as I had hoped. For instance, names of local trees and flowers being tied to the local geographic regions where they’re found. However, cookie cutter suburban neighborhood developments seem to have obliterated any causation. “Magnolia” is such a nice sounding, outdoorsy word; who wouldn’t want it adorning their street corner? Local flora be damned.

There are, however, a few other interesting tidbits in the data that I hope to cover in a future project. Real work be damned.

Friday, April 25, 2008 | allstreets  
Book

Visualizing Data Book CoverVisualizing Data is my 2007 book about computational information design. It covers the path from raw data to how we understand it, detailing how to begin with a set of numbers and produce images or software that lets you view and interact with information. When first published, it was the only book(s) for people who wanted to learn how to actually build a data visualization in code.

The text was published by O’Reilly in December 2007 and can be found at Amazon and elsewhere. Amazon also has an edition for the Kindle, for people who aren’t into the dead tree thing. (Proceeds from Amazon links found on this page are used to pay my web hosting bill.)

Examples for the book can be found here.

The book covers ideas found in my Ph.D. dissertation, which is the basis for Chapter 1. The next chapter is an extremely brief introduction to Processing, which is used for the examples. Next is (chapter 3) is a simple mapping project to place data points on a map of the United States. Of course, the idea is not that lots of people want to visualize data for each of 50 states. Instead, it’s a jumping off point for learning how to lay out data spatially.

The chapters that follow cover six more projects, such as salary vs. performance (Chapter 5), zipdecode (Chapter 6), followed by more advanced topics dealing with trees, treemaps, hierarchies, and recursion (Chapter 7), plus graphs and networks (Chapter 8).

This site is used for follow-up code and writing about related topics.