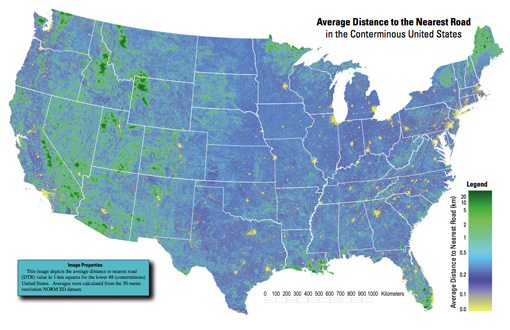
Average Distance to the Nearest Road in the Conterminous United States
Got an email over the weekend from Tom Vanderbilt, who had seen the All Streets piece, and was kind enough to point me to this map (PDF) from the USGS that depicts the average distance to the nearest road across the continental 48 states. (He’s currently working on a book titled Traffic: Why We Drive the Way We Do (and What It Says About Us) to be released this fall).
And too bad I just learned the word conterminous, but had I used that in the original project description, we would have missed (or been spared) the Metafilter discussion of whether “lower 48” was accurate terminology.

A really interesting map, which of course also shows the difference between something thrown together in a few hours and actual research. In digging around for the map’s source, I found that exactly a year ago, they also published a paper in Science describing their broader work:
Roads encroaching into undeveloped areas generally degrade ecological and watershed conditions and simultaneously provide access to natural resources, land parcels for development, and recreation. A metric of roadless space is needed for monitoring the balance between these ecological costs and societal benefits. We introduce a metric, roadless volume (RV), which is derived from the calculated distance to the nearest road. RV is useful and integrable over scales ranging from local to national. The 2.1 million cubic kilometers of RV in the conterminous United States are distributed with extreme inhomogeneity among its counties.
The publication even includes a response and a response to the response—high scientific drama! Apparently some lads feel that “roadless volume does not explicitly address ecological processes.” So let that be a warning to all you non-explicit addressers.
For those lucky to have access to the journal online, the supplementary information includes a time lapse video of a section of Colorado, and its roadless volume since 1937. As with all things, it’s much more interesting to see how this changes over time. A map of all streets in the lower 48 isn’t nearly as engaging as a sequence of the same area over several years. The latter story is simply far more compelling.

