Inspired by this post by Kurt Opsahl of the EFF, Matt McKeon of IBM’s Visual Communication Lab created the following visualization depicting the evolution of the default privacy settings on Facebook:

Has a couple nice visual touches that prevent it from looking like YAHSVPOQUFOTI (yet another highly-stylized visualization piece of questionable utility found on the internet). Also cool to see it was built with Processing.js.
Just posted an essay about the work of artist Mark Lombardi that I presented at Experimenta Design in Lisbon last week. I don’t usually post lectures, but this is a kind of work-in-progress that I’m trying to sort out for myself.

For the panel, we were to choose “an individual, movement, technology, whatever – whose importance has been overlooked” and follow that with “two themes that [we] believe will define the future of design and architecture.” In that context, I chose Lombardi’s work, and how it highlights a number of themes that are important to the future of design, particularly in working with data.
 BusinessWeek has an excerpt of Numerati, a book about the fabled monks of data mining (publishers weekly calls them “entrepreneurial mathematicians”) who are sifting through the personal data we create every day.
Picture an IBM manager who gets an assignment to send a team of five to set up a call center in Manila. She sits down at the computer and fills out a form. It’s almost like booking a vacation online. She puts in the dates and clicks on menus to describe the job and the skills needed. Perhaps she stipulates the ideal budget range. The results come back, recommending a particular team. All the skills are represented. Maybe three of the five people have a history of working together smoothly. They all have passports and live near airports with direct flights to Manila. One of them even speaks Tagalog.
Everything looks fine, except for one line that’s highlighted in red. The budget. It’s $40,000 over! The manager sees that the computer architect on the team is a veritable luminary, a guy who gets written up in the trade press. Sure, he’s a 98.7% fit for the job, but he costs $1,000 an hour. It’s as if she shopped for a weekend getaway in Paris and wound up with a penthouse suite at the Ritz.
Hmmm. The manager asks the system for a cheaper architect. New options come back. One is a new 29-year-old consultant based in India who costs only $85 per hour. That would certainly patch the hole in the budget. Unfortunately, he’s only a 69% fit for the job. Still, he can handle it, according to the computer, if he gets two weeks of training. Can the job be delayed?
This is management in a world run by Numerati.
I’m highly skeptical of management (a fundamentally human activity) being distilled to numbers in this manner. Unless, of course, the managers are that poor at doing their job. And further, what’s the point of the manager if they’re spending most of their time filling out the vacation form-style work order? (Filling out tedious year-end reviews, no doubt.) Perhaps it should be an indication that the company is simply too large:
As IBM sees it, the company has little choice. The workforce is too big, the world too vast and complicated for managers to get a grip on their workers the old-fashioned way—by talking to people who know people who know people.
Then we descend (ascend?) into the rah-rah of today’s global economy:
Word of mouth is too foggy and slow for the global economy. Personal connections are too constricted. Managers need the zip of automation to unearth a consultant in New Delhi, just the way a generation ago they located a shipment of condensers in Chicago. For this to work, the consultant—just like the condensers—must be represented as a series of numbers.
I say rah-rah because how else can you put refrigeration equipment parts in the same sentence as a living, breathing person with a mind, free will and a life.
And while I don’t think I agree with this particular thesis, the book as a whole looks like an interesting survey of efforts in this area. Time to finish my backlog of Summer reading so I can order more books…
 “Mapping Iran’s Online Public” is a fascinating (and very readable) paper from a study by John Kelly and Bruce Etling at Harvard’s Berkman Center. From the abstract:
In contrast to the conventional wisdom that Iranian bloggers are mainly young democrats critical of the regime, we found a wide range of opinions representing religious conservative points of view as well as secular and reform-minded ones, and topics ranging from politics and human rights to poetry, religion, and pop culture. Our research indicates that the Persian blogosphere is indeed a large discussion space of approximately 60,000 routinely updated blogs featuring a rich and varied mix of bloggers.
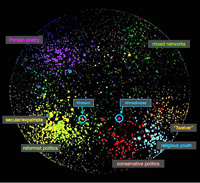
In addition to identifying four major poles (Secular/Reformist, Conservative/Religious, Persian Poetry and Literature, and Mixed Networks.) A number of surprising findings include details like the nature of discourse (such as the prominence of the poetry and literature category) or issues of anonymity:
…a minority of bloggers in the secular/reformist pole appear to blog anonymously, even in the more politically-oriented part of it; instead, it is more common for bloggers in the religious/conservative pole to blog anonymously. Blocking of blogs by the government is less pervasive than we had assumed.
They also produced images to represent the nature of the networks, seen in the thumbnail at right. The visualization is created with a force-directed layout that iteratively groups data points closer based on their content. It’s useful for this kind of study, where the intent is to represent or identify larger groups. In this case, the graphic supports what’s laid out in the text, but to me the most interesting thing about the study is the human-centered tasks of the project, such as the work done by hand in reviewing and categorizing such a large number of sites. It’s this background work that sets it apart from many other images like it which tend to rely too heavily on automation.
(The paper is from April 6, 2008 and I first heard about after being contacted by John in June. Around 1999, our group had hosted students that he was teaching in a summer session for a visit to the Media Lab. And now a few months later, I’m digging through my writing todo pile.)
Obscenity law in the United States is based on Miller vs. California, a precedent set in 1973:
“(a) whether the ‘average person, applying contemporary community standards’ would find that the work, taken as a whole, appeals to the prurient interest,
(b) whether the work depicts or describes, in a patently offensive way, sexual conduct specifically defined by the applicable state law, and
(c) whether the work, taken as a whole, lacks serious literary, artistic, political, or scientific value.”
Of course, the definition of an average person or community standards isn’t quite as black and white as most Supreme Court decisions. In a new take, the lawyer defending the owner of a pornography site in Florida is using Google Trends to produce what he feels is a more accurate definition of community standards:
In the trial of a pornographic Web site operator, the defense plans to show that residents of Pensacola are more likely to use Google to search for terms like “orgy” than for “apple pie” or “watermelon.” The publicly accessible data is vague in that it does not specify how many people are searching for the terms, just their relative popularity over time. But the defense lawyer, Lawrence Walters, is arguing that the evidence is sufficient to demonstrate that interest in the sexual subjects exceeds that of more mainstream topics — and that by extension, the sexual material distributed by his client is not outside the norm.
Below, “surfing” in blue, “orgy” in red, and “apple pie” in orange:
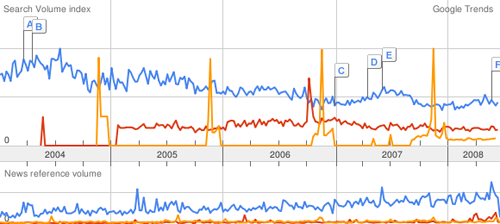
A clever defense. The trends can also be localized to roughly the size of a large city or county, which arguably might be considered the “community.” The New York Times article continues:
“Time and time again you’ll have jurors sitting on a jury panel who will condemn material that they routinely consume in private,” said Mr. Walters, the defense lawyer. Using the Internet data, “we can show how people really think and feel and act in their own homes, which, parenthetically, is where this material was intended to be viewed,” he added.
Fascinating that there could actually be something even remotely quantifiable about community standards. “I know it when I see it” is inherently subjective, so is any introduction of objectivity an improvement? For more perspective, I recommend this article from FindLaw, which describes the history of “Movie Day” at the Supreme Court and the evolution of obscenity law.
The trends data has many inherent problems (lack of detail for one), but is another indicator of what we can learn from Google. Most important to me, the case provides an example of what it means for search engines to capture this information, because it demonstrates to the public at large (not just people who think about data all day) how the information can be used. As more information is collected about us, search engine data provides an imperfect mirror onto our society, previously known only to psychiatrists and priests.
 Matt Mullenweg, creator of WordPress, speaking at the “Future of Web Apps” conference in February:
Spammers are “the terrorists of Web 2.0,” Mullenweg said. “They come into our communities and take advantage of our openness.” He suggested that people may have moved away from e-mail and toward messaging systems like Facebook messaging and Twitter to get away from spam. But with all those “zombie bites” showing up in his Facebook in-box, he explained, the spammers are pouncing on openness once again.
I don’t think that “terrorists” is the right word—they’re not taking actions with an intent to produce fear that will prevent people from using online communities (much less killing bloggers or kidnapping Facebook users). What I like about this quote is the idea that “they take advantage of openness,” which puts it well. There needs to be a harsher way to describe this situation than “spamming” which suggests a minor annoyance. There’s nothing like spending a Saturday morning cleaning out the Processing discussion board, or losing an afternoon modifying the bug database to keep it safer from these losers. It’s a bit like people who crack machines out of maliciousness or boredom—it’s incredibly time consuming to clean up the mess, and incredibly frustrating when it’s something done in your spare time (like Processing) or to help out the group (during grad school at the ACG).
So it’s somewhere between graffiti and terrorism, but it doesn’t match either because the social impact at either end of that scale is incredibly different (graffiti can be a positive thing, and terrorism is a real world thing where people die).
On a more positive note, and for what it’s worth, I highly recommend WordPress. It’s obvious that it’s been designed and built by people who actually use it, which means that the interface is pleasantly intuitive. And not surprising that it was initially created by such a character.
A New York Times article from February about the difficulty of removing your personal information from Facebook. I believe that in the days that followed Facebook responded by making it ever-so-slightly possible to actually remove your account (though still not very easy).
Further, there is the network effect of information that’s not “just” your own. Deleting a Facebook profile does not appear to delete posts you’ve made to “the wall” of any friends, for instance. Do you own those comments? Does your friend? It’s a somewhat similar situation in other areas—even if I chose not to have a Gmail account, because I don’t like their data retention policy, all my email sent to friends with Gmail accounts is subject to those terms I’m unhappy with.
Regardless, this is an enormous issue as we put more of our data online. What does it mean to have this information public? What happens when you change your mind?
Facebook stands out because it’s a scenario of starting college (at age 17 or 18 or now even earlier), having a very different view of what’s public and private, and that evolving over time. You may not care to have things public at the time, but one of the best things about college (or high school, for that matter) is that you move on. Having a log of your outlook, attitude, and photos to prove it that is stored on a a company’s servers means that there are more permanent memories of the time which are out of your control. (And you don’t know who else beside Facebook is storing it—search engine caches, companies doing data mining, etc. all take a role here.) Your own memories might be lost to alcohol or willful forgetfulness, but digital copies don’t behave the same way.
The bottom line is an issue of ownership of one’s own personal information. At this point, we’re putting more information online—whether it’s Facebook or having all your email stored by Gmail—but we haven’t figured out what that really means.

