
Zipdecode in der Schweiz
 Dominic Allemann has developed a Swiss version of the zipdecode example from chapter six of Visualizing Data. This is the whole point of the book—to actually try things out and adapt them in different ways and see what you can learn from it.
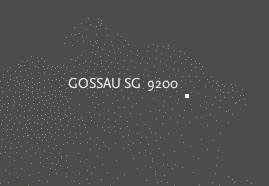
Switzerland makes an interesting example because it has far fewer postal codes than the U.S., though the dots are quite elegant on their own. With fewer data points, I’d be inclined to 1) change the size of the individual points to make them larger without making them overwhelming, 2) or work with the colors to make the contrast more striking, since changing the point size is likely to be too much), and 3) get the text into mixed case (in this example, Gossau SG instead of GOSSAU SG). Something as minor as avoiding ALL CAPS helps get us away from the representation looking too much like COMPUTERS and DATABASES, and instead into something meant for regular humans. Finally, 4) with the smaller (and far more regular) data set, it’s not clear if the zoom even helps—could even be better off without it.
Thanks to Dominic for passing this along; it’s great to see!
