Writing

Sometimes, the map plays with you

cnn-250.jpgI missed seeing it live, but was told about it by a baffled friend who muttered about watching CNN and that the anchors were having a little too much fun with a new touch-screen toy while they covered returns for the primaries. The Washington Post provides more details.

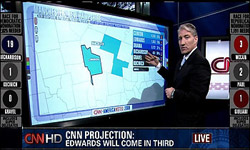
Standing in front of an oversize monitor, King began poking, touching and waving at the screen like an over-caffeinated traffic cop. Each movement set in motion a series of zooming maps and flying pie charts, which King was then able to position around the screen at will.

The story also references Tim Russert’s much-talked-about (and I’d-forgotten-about) whiteboard scribbling for the 2000 election, which has me wondering about which presentation was actually more informative for viewers.

Thankfully, The Daily Show provides some insight:

Tuesday, February 26, 2008 | election  
Book

Visualizing Data Book CoverVisualizing Data is my 2007 book about computational information design. It covers the path from raw data to how we understand it, detailing how to begin with a set of numbers and produce images or software that lets you view and interact with information. When first published, it was the only book(s) for people who wanted to learn how to actually build a data visualization in code.

The text was published by O’Reilly in December 2007 and can be found at Amazon and elsewhere. Amazon also has an edition for the Kindle, for people who aren’t into the dead tree thing. (Proceeds from Amazon links found on this page are used to pay my web hosting bill.)

Examples for the book can be found here.

The book covers ideas found in my Ph.D. dissertation, which is the basis for Chapter 1. The next chapter is an extremely brief introduction to Processing, which is used for the examples. Next is (chapter 3) is a simple mapping project to place data points on a map of the United States. Of course, the idea is not that lots of people want to visualize data for each of 50 states. Instead, it’s a jumping off point for learning how to lay out data spatially.

The chapters that follow cover six more projects, such as salary vs. performance (Chapter 5), zipdecode (Chapter 6), followed by more advanced topics dealing with trees, treemaps, hierarchies, and recursion (Chapter 7), plus graphs and networks (Chapter 8).

This site is used for follow-up code and writing about related topics.