Writing

Visualizing Data with Portuguese and Processing.js

Very cool! Check out these implementations of several Visualizing Data examples that make use of John Resig’s Processing.js, an adaptation of the Processing API with pure JavaScript. This means running in a web browser with no additional plug-ins (no Java Virtual Machine kicking in while you take a sip of coffee—much less drain the whole cup, depending the speed of your computer). Since the first couple chapters cover straightforward, static exercises, I’d been wanting to try this, but it’s more fun when someone beats you to it. (Nothing is better than feeling like a slacker, after all.)

map-example.png
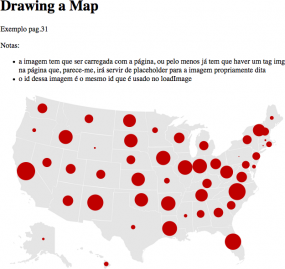
View the introductory Processing sketch from Page 22, or the map of the United States populated with random data points from Page 35.

Babelfish translation of the page here, with choice quotes like “also the shipment of external filing-cabinets had that to be different of what was in the book.”

And the thing is, when I finished the proof of the book for O’Reilly, I had this uneasy feeling that I was shipping the wrong filing-cabinets. Particularly the external ones.

Monday, November 17, 2008 | examples, processing, translation, vida  
Book

Visualizing Data Book CoverVisualizing Data is my 2007 book about computational information design. It covers the path from raw data to how we understand it, detailing how to begin with a set of numbers and produce images or software that lets you view and interact with information. When first published, it was the only book(s) for people who wanted to learn how to actually build a data visualization in code.

The text was published by O’Reilly in December 2007 and can be found at Amazon and elsewhere. Amazon also has an edition for the Kindle, for people who aren’t into the dead tree thing. (Proceeds from Amazon links found on this page are used to pay my web hosting bill.)

Examples for the book can be found here.

The book covers ideas found in my Ph.D. dissertation, which is the basis for Chapter 1. The next chapter is an extremely brief introduction to Processing, which is used for the examples. Next is (chapter 3) is a simple mapping project to place data points on a map of the United States. Of course, the idea is not that lots of people want to visualize data for each of 50 states. Instead, it’s a jumping off point for learning how to lay out data spatially.

The chapters that follow cover six more projects, such as salary vs. performance (Chapter 5), zipdecode (Chapter 6), followed by more advanced topics dealing with trees, treemaps, hierarchies, and recursion (Chapter 7), plus graphs and networks (Chapter 8).

This site is used for follow-up code and writing about related topics.