
Gaming the GM
Via News.com, the peculiar story of MLB Front Office Manager, a sports simulation game in which you play the general manager of a major league baseball team. Daniel Terdiman writes:
The new game — which is unlike any baseball video game I’ve ever seen — has perhaps the perfect pitchman, Oakland A’s General Manager Billy Beane. For those not familiar with him, the game probably won’t mean much, since as the main subject of Michael Lewis’ hit book, Moneyball, Beane has long been considered the most cerebral and efficient guy putting contending baseball teams on the field.
This caught my eye because of its focus on the numbers, and how you’d pull that off in the context of a console game.
A “first look” review from GameSpot notes:
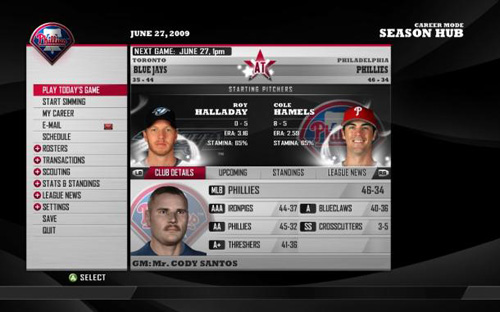
As you may imagine, FOM’s interface is menu heavy, providing access to the various statistical metrics and trends to keep you apprised as general manager. What is surprising is that FOM manages to bring this depth to the console as well as the PC. While other console-based franchise management titles have struggled to create effective navigation tools, FOB’s vertical menu interface is both clean and intuitive without compromising the depth one would expect from a game in this genre. Top-level categories include submenus (many of which include further submenus) similar to navigating a sports Web site.
Other reviews seem to be less charitable, but I’m less interested in the game itself than the curiosity that it exists in the first place. GameSpot describes the audience:
By 2K’s own admission, the game targets a specific niche: the roughly 3.5 million participants of Fantasy Baseball leagues. It is 2K’s hope that this hardcore baseball audience, many of whom spend two to three hours every day managing their fantasy rosters, will see FOM as a convenient alternative (or even a complement, assuming those individuals forgo sleep).
So it’s a niche, as would be expected. But I’m curious about a handful of issues, a combination of not knowing much about gaming, mixed with a fascination for what gaming means for interfaces:
- Could this be done properly, to a point where a game like this is a wider success? The niche audience is interesting at first, but is it possible to take a numbers game to a broader audience than that?
- Has anyone already had success doing that?
- Are there methods for showing complex numbers, data, and stats that have been used in (particularly console) games that are more effective than typical information dashboards used by, say, corporations?
The combination of having a motivated user who is willing to put up with the numbers suggests that some really interesting things could be done. And because the interface has to be optimized for the limited interaction afforded by a handheld controller (if played on a console) suggests that the implementation would also need to be clever.
If you have any insight, please drop me a line. Or you can continue to speculate for yourself while enjoying the promotional video below with the most fantastically awful background music I’ve heard since Microsoft Songsmith appeared a little while ago.
