Writing

Representing power usage in the sky

collage123_600.jpgWonderful project that shows power usage mapped to a green cloud, projected into the sky and onto the output of the Salmisaari power plant in Helsinki. From their description:

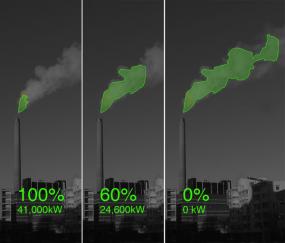
Every night from the 22 to the 29 of February 2008, the vapour emissions of he Salmisaari power plant in Helsinki will be illuminated to show the current levels of electricity consumption by local residents. A laser ray will trace the cloud during the night time and turn it into a city scale neon sign. Nuage Vert is a communal event for the area of Ruoholahti, which anticipates esoteric cults centred on energy and transforms an active power plant into a space for art, a living factory. In tandem, as a reversal of conventional roles whereby the post-industrial factory is turned into space for culture, Kaapeli (the cultural factory) becomes the site of operation and Salmisaari (the industrious factory) becomes the site of spectacle.

Check out their blog page with updates and pictures.

Thursday, April 24, 2008 | physical  
Book

Visualizing Data Book CoverVisualizing Data is my book about computational information design. It covers the path from raw data to how we understand it, detailing how to begin with a set of numbers and produce images or software that lets you view and interact with information. Unlike nearly all books in this field, it is a hands-on guide intended for people who want to learn how to actually build a data visualization.

The text was published by O’Reilly in December 2007 and can be found at Amazon and elsewhere. People who have purchased the book can find the examples here.

The book covers ideas found in my Ph.D. dissertation, which is basis for Chapter 1. The next chapter is an extremely brief introduction to Processing, which is used for the examples. but applies them to a series of examples, first starting with a simple mapping project (Chapter 3) to place data points on a map of the United States. Of course, the idea is not that lots of people want to visualize data for each of 50 states. Instead, it’s a jumping off point for learning how to lay out data spatially.

The chapters that follow cover six more projects, such as salary vs. performance (Chapter 5), zipdecode (Chapter 6), followed by more advanced topics dealing with trees, treemaps, hierarchies, and recursion (Chapter 7), plus graphs and networks (Chapter 8).

This site will be used for follow-up code and writing about related topics.