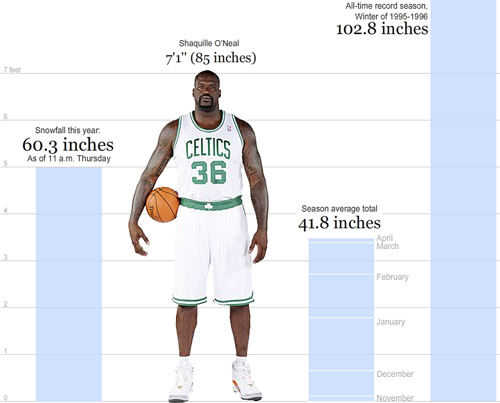
Another wonderful example, more powerful as words than as an image:
Jan Pen, a Dutch economist who died last year, came up with a striking way to picture inequality. Imagine people’s height being proportional to their income, so that someone with an average income is of average height. Now imagine that the entire adult population of America is walking past you in a single hour, in ascending order of income.
The first passers-by, the owners of loss-making businesses, are invisible: their heads are below ground. Then come the jobless and the working poor, who are midgets. After half an hour the strollers are still only waist-high, since America’s median income is only half the mean. It takes nearly 45 minutes before normal-sized people appear. But then, in the final minutes, giants thunder by. With six minutes to go they are 12 feet tall. When the 400 highest earners walk by, right at the end, each is more than two miles tall.
(From The Economist, by way of Eva)
Fascinating editorial from chess champion Gary Kasparov, about the relationship between humans and machines:
The AI crowd, too, was pleased with the result and the attention, but dismayed by the fact that Deep Blue was hardly what their predecessors had imagined decades earlier when they dreamed of creating a machine to defeat the world chess champion. Instead of a computer that thought and played chess like a human, with human creativity and intuition, they got one that played like a machine, systematically evaluating 200 million possible moves on the chess board per second and winning with brute number-crunching force. As Igor Aleksander, a British AI and neural networks pioneer, explained in his 2000 book, How to Build a Mind:
By the mid-1990s the number of people with some experience of using computers was many orders of magnitude greater than in the 1960s. In the Kasparov defeat they recognized that here was a great triumph for programmers, but not one that may compete with the human intelligence that helps us to lead our lives.
It was an impressive achievement, of course, and a human achievement by the members of the IBM team, but Deep Blue was only intelligent the way your programmable alarm clock is intelligent. Not that losing to a $10 million alarm clock made me feel any better.
He continues to describe playing games with humans aided by computers, and how it made the game even more dependent upon creativity:
Having a computer program available during play was as disturbing as it was exciting. And being able to access a database of a few million games meant that we didn’t have to strain our memories nearly as much in the opening, whose possibilities have been thoroughly catalogued over the years. But since we both had equal access to the same database, the advantage still came down to creating a new idea at some point.
Or some of the other effects:
Having a computer partner also meant never having to worry about making a tactical blunder. The computer could project the consequences of each move we considered, pointing out possible outcomes and countermoves we might otherwise have missed. With that taken care of for us, we could concentrate on strategic planning instead of spending so much time on calculations. Human creativity was even more paramount under these conditions. Despite access to the “best of both worlds,” my games with Topalov were far from perfect. We were playing on the clock and had little time to consult with our silicon assistants. Still, the results were notable. A month earlier I had defeated the Bulgarian in a match of “regular” rapid chess 4–0. Our advanced chess match ended in a 3–3 draw. My advantage in calculating tactics had been nullified by the machine.
The final reinforces that I’d heard others describe Kasparov’s play as machine-like in the past (in a sense, this is verification or even quantification of that idea). It also includes some interesting comments on numerical scale:
The number of legal chess positions is 1040, the number of different possible games, 10120. Authors have attempted various ways to convey this immensity, usually based on one of the few fields to regularly employ such exponents, astronomy. In his book Chess Metaphors, Diego Rasskin-Gutman points out that a player looking eight moves ahead is already presented with as many possible games as there are stars in the galaxy. Another staple, a variation of which is also used by Rasskin-Gutman, is to say there are more possible chess games than the number of atoms in the universe. All of these comparisons impress upon the casual observer why brute-force computer calculation can’t solve this ancient board game. They are also handy, and I am not above doing this myself, for impressing people with how complicated chess is, if only in a largely irrelevant mathematical way.
And one last statement:
Our best minds have gone into financial engineering instead of real engineering, with catastrophic results for both sectors.
In the article, Kasparov mentions Moravec’s Paradox, described by Wikipedia as:
“contrary to traditional assumptions, the uniquely human faculty of reason (conscious, intelligent, rational thought) requires very little computation, but that the unconscious sensorimotor skills and instincts that we share with the animals require enormous computational resources”
And another interesting notion:
Marvin Minsky emphasizes that the most difficult human skills to reverse engineer are those that are unconscious. “In general, we’re least aware of what our minds do best,” he writes, and adds “we’re more aware of simple processes that don’t work well than of complex ones that work flawlessly.”
Scale is one of the most important themes in data visualization. In Monty Python’s The Meaning of Life, Eric Idle shares his perspective:
The lyrics:
Just remember that you’re standing on a planet that’s evolving
And revolving at nine hundred miles an hour,
That’s orbiting at nineteen miles a second, so it’s reckoned,
A sun that is the source of all our power.
The sun and you and me and all the stars that we can see
Are moving at a million miles a day
In an outer spiral arm, at forty thousand miles an hour,
Of the galaxy we call the ‘Milky Way’.
Our galaxy itself contains a hundred billion stars.
It’s a hundred thousand light years side to side.
It bulges in the middle, sixteen thousand light years thick,
But out by us, it’s just three thousand light years wide.
We’re thirty thousand light years from galactic central point.
We go ’round every two hundred million years,
And our galaxy is only one of millions of billions
In this amazing and expanding universe.
The universe itself keeps on expanding and expanding
In all of the directions it can whizz
As fast as it can go, at the speed of light, you know,
Twelve million miles a minute, and that’s the fastest speed there is.
So remember, when you’re feeling very small and insecure,
How amazingly unlikely is your birth,
And pray that there’s intelligent life somewhere up in space,
‘Cause there’s bugger all down here on Earth. 
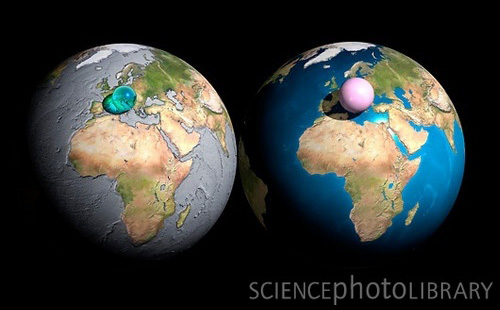
From a post by Dan Phiffer, an image by Adam Nieman and the Science Photo Library.
All the water in the world (1.4087 billion cubic kilometers of it) including sea water, ice, lakes, rivers, ground water, clouds, etc. Right: All the air in the atmosphere (5140 trillion tonnes of it) gathered into a ball at sea-level density. Shown on the same scale as the Earth.

More information at the original post. (Thanks to Eugene for the link.)


