Allie Brosh, who appears to be some sort of genius, brings us definitive arguments in the cake versus pie debate. Best to read the entire treatise, but here are a few highlights on how clearly pie defeats cake:
Ability of enjoyment to be sustained over time
Couldn’t agree more: it always seems like a good idea on the first bite, and then I catch myself. What am I doing? I hate cake. Another graphic:
Unequal frosting distribution is a problem
I grew up requesting pie for my birthday (strawberry rhubarb, thank you very much) instead of cake. This resonates. More importantly (for this site), Brosh cites the enormous impact of pie vs. cake for information design and visualization:
Colin Raney turned me on to this project (podcast? article? info graphic? series? part of what’s great is that there isn’t really a good term for this) by the team of five running the Planet Money podcast for NPR. To explain toxic assets, they bought one, and are now tracking its demise:
Here I’m showing the info graphic, which is just one component of telling the broader story. The series does a great job of balancing 1) investigative journalism (an engaging story), 2) participation by a small team (the four reporters plus their producer each pooled $200 apiece), 3) timely and relevant, 4) really understanding an issue (toxic assets are in the news but we still don’t quite get it), 5) distribution (blog with updates, regular podcast), and 6) telling a story with information graphics (being able to track what’s happening with the asset).
I could keep adding to that numbered list, but my hastily and poorly worded point is that the idea is just right.
Perhaps if the papers weren’t so busy wringing their hands about the loss of classified ads, maybe this would have been the norm five years ago when it should have been. But it’s a great demonstration of where we need to be with online news, particularly as it’s consumed with all these $500 devices we keep purchasing, that deliver the news in a tiny, scrolly text format that echoes the print version. A print format that’s 100s of years old.
Anyhow, this is great. Cheers to the Planet Money folks.
(Another interesting perspective here, from TechDirt, which was the original link I read.)
My favorite part of this week’s Seminar on Innovative Approaches to Turn Statistics into Knowledge (aside from its comically long name) was the presentation from Amanda Cox of The New York Times. She showed three particular projects which are a little further up the complexity scale as compared to a lot of the work from the Times, and much more like the sort of numerical messes that catch my interest. The three serve are also a great cross-section of Amanda’s work with her collaborators, so I’m posting them here. Check ’em out:
And finally, “Turning a Corner?” which is perhaps the most complicated of the bunch, but gets more interesting as you spend a little more time with it.
This month’s pirate reference comes to us by way of the theory of the Flying Spaghetti Monster. The theory was first introduced in an open letter from Bobby Henderson to the Kansas State Board of Education after deciding that creationism must be taught alongside the theory of evolution. I had disregarded the Spaghetti Monster as a heavy-handed response to the hard-headed, but had missed this important bit of context:
You may be interested to know that global warming, earthquakes, hurricanes, and other natural disasters are a direct effect of the shrinking numbers of Pirates since the 1800s. For your interest, I have included a graph of the approximate number of pirates versus the average global temperature over the last 200 years. As you can see, there is a statistically significant inverse relationship between pirates and global temperature.
A stunning find! And like an overly literal translation of the bible, so accurate — except when it’s not. The horizontal scale, as Edward Tufte would say, “repays careful study.”
Saudi Aramco was originally an American company. It goes way back to the 1930s when two American geologists from Standard Oil of California discovered oil in the Saudi desert.
Standard Oil formed a consortium with Texaco, Exxon and Mobil, which became Aramco. It wasn’t until the 1980s that Saudi Arabia bought them out and nationalized the company. Today, Saudi Aramco is the custodian of the country’s sole source of wealth and power.
Over 16,000 people work at the company’s massive compound, which is like a little country with its own security force, schools, hospitals, and even its own airline.
According to Abdallah Jum’ah, Saudi Aramco’s president and CEO, Aramco is the world’s largest oil producing company.
And it’s the richest company in the world, worth, according to the latest estimate, $781 billion.
I was about to change the channel (perhaps as you were just about to stop reading this post), when they showed the big board:
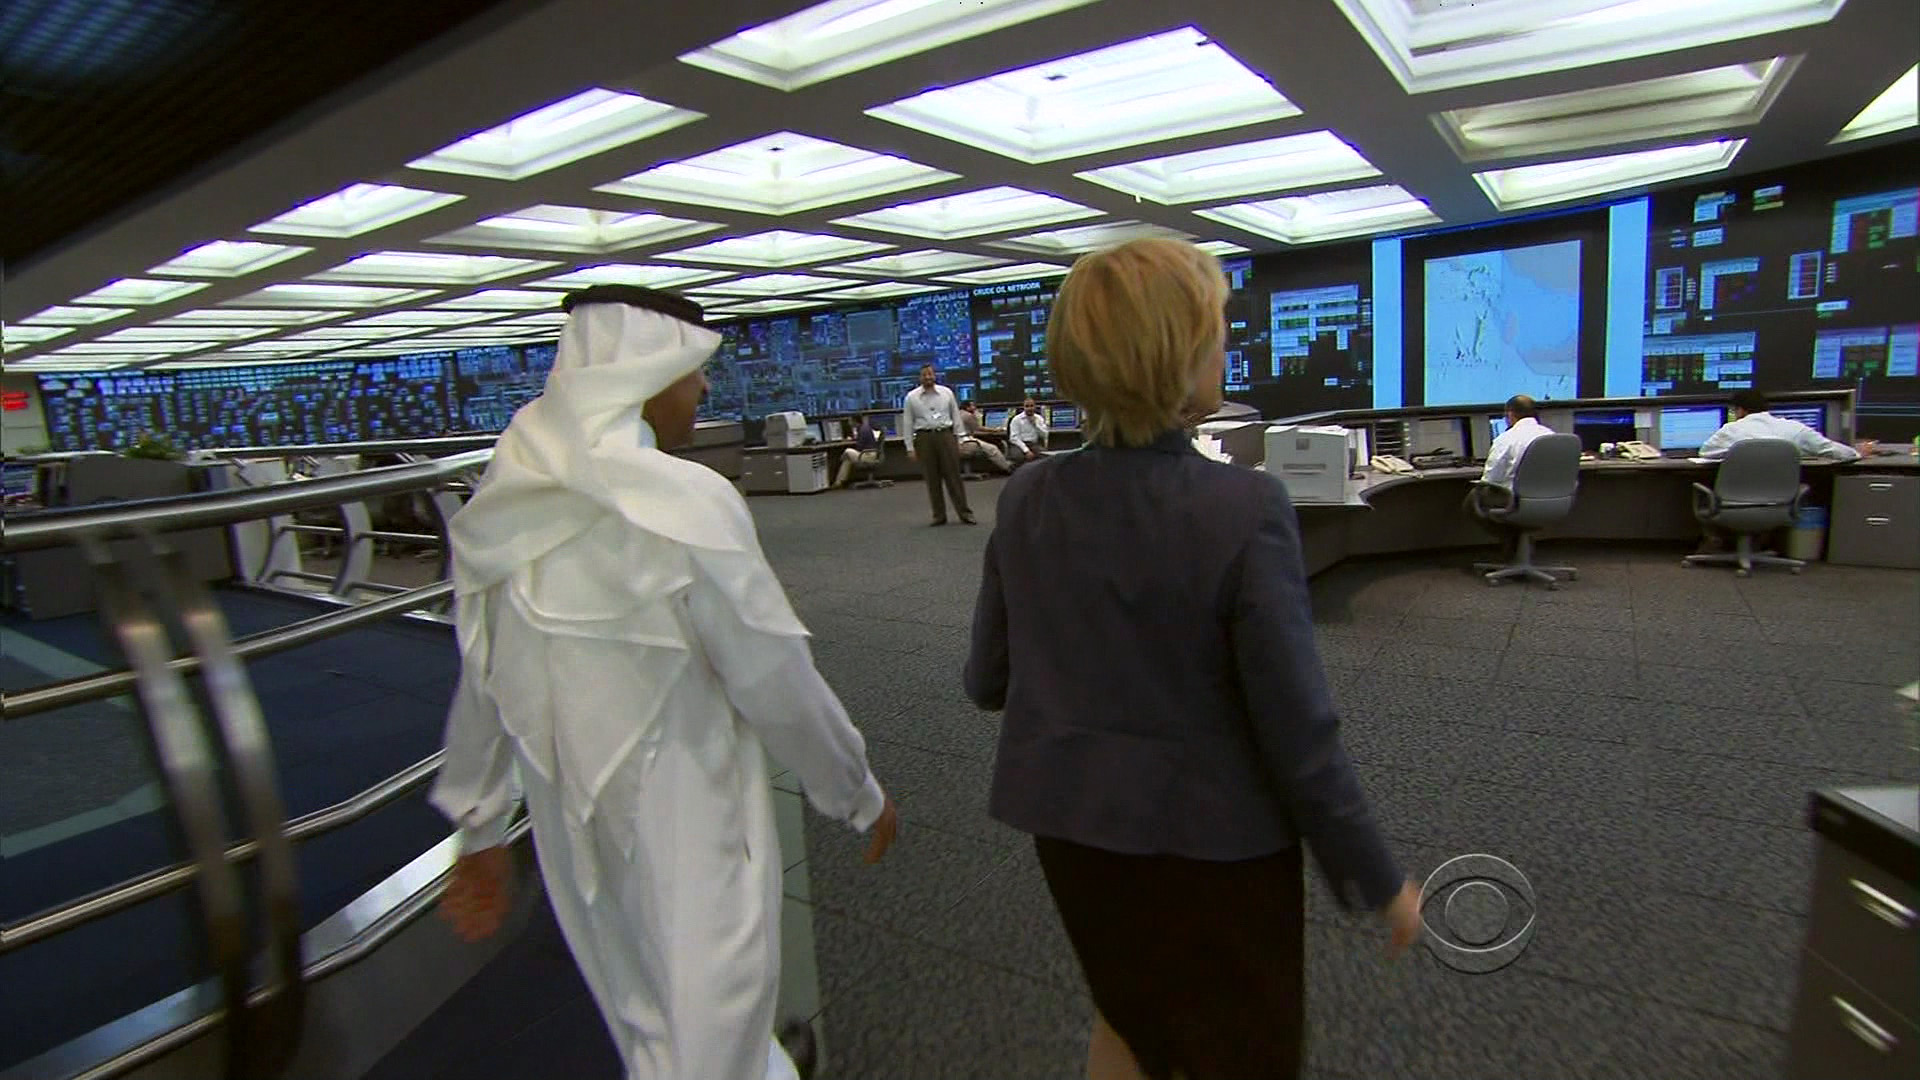
Jum’ah gave 60 Minutes a tour of the company’s command center, where engineers scrutinize and analyze every aspect of the company’s operations on a 220-foot digital screen.
“Every facility in the kingdom, every drop of oil that comes from the ground is monitored in real time in this room,” Jum’ah explained. “And we have control of each and every facility, each and every pipeline, each and every valve on the pipeline. And therefore, we know exactly what is happening in the system from A to Z.”
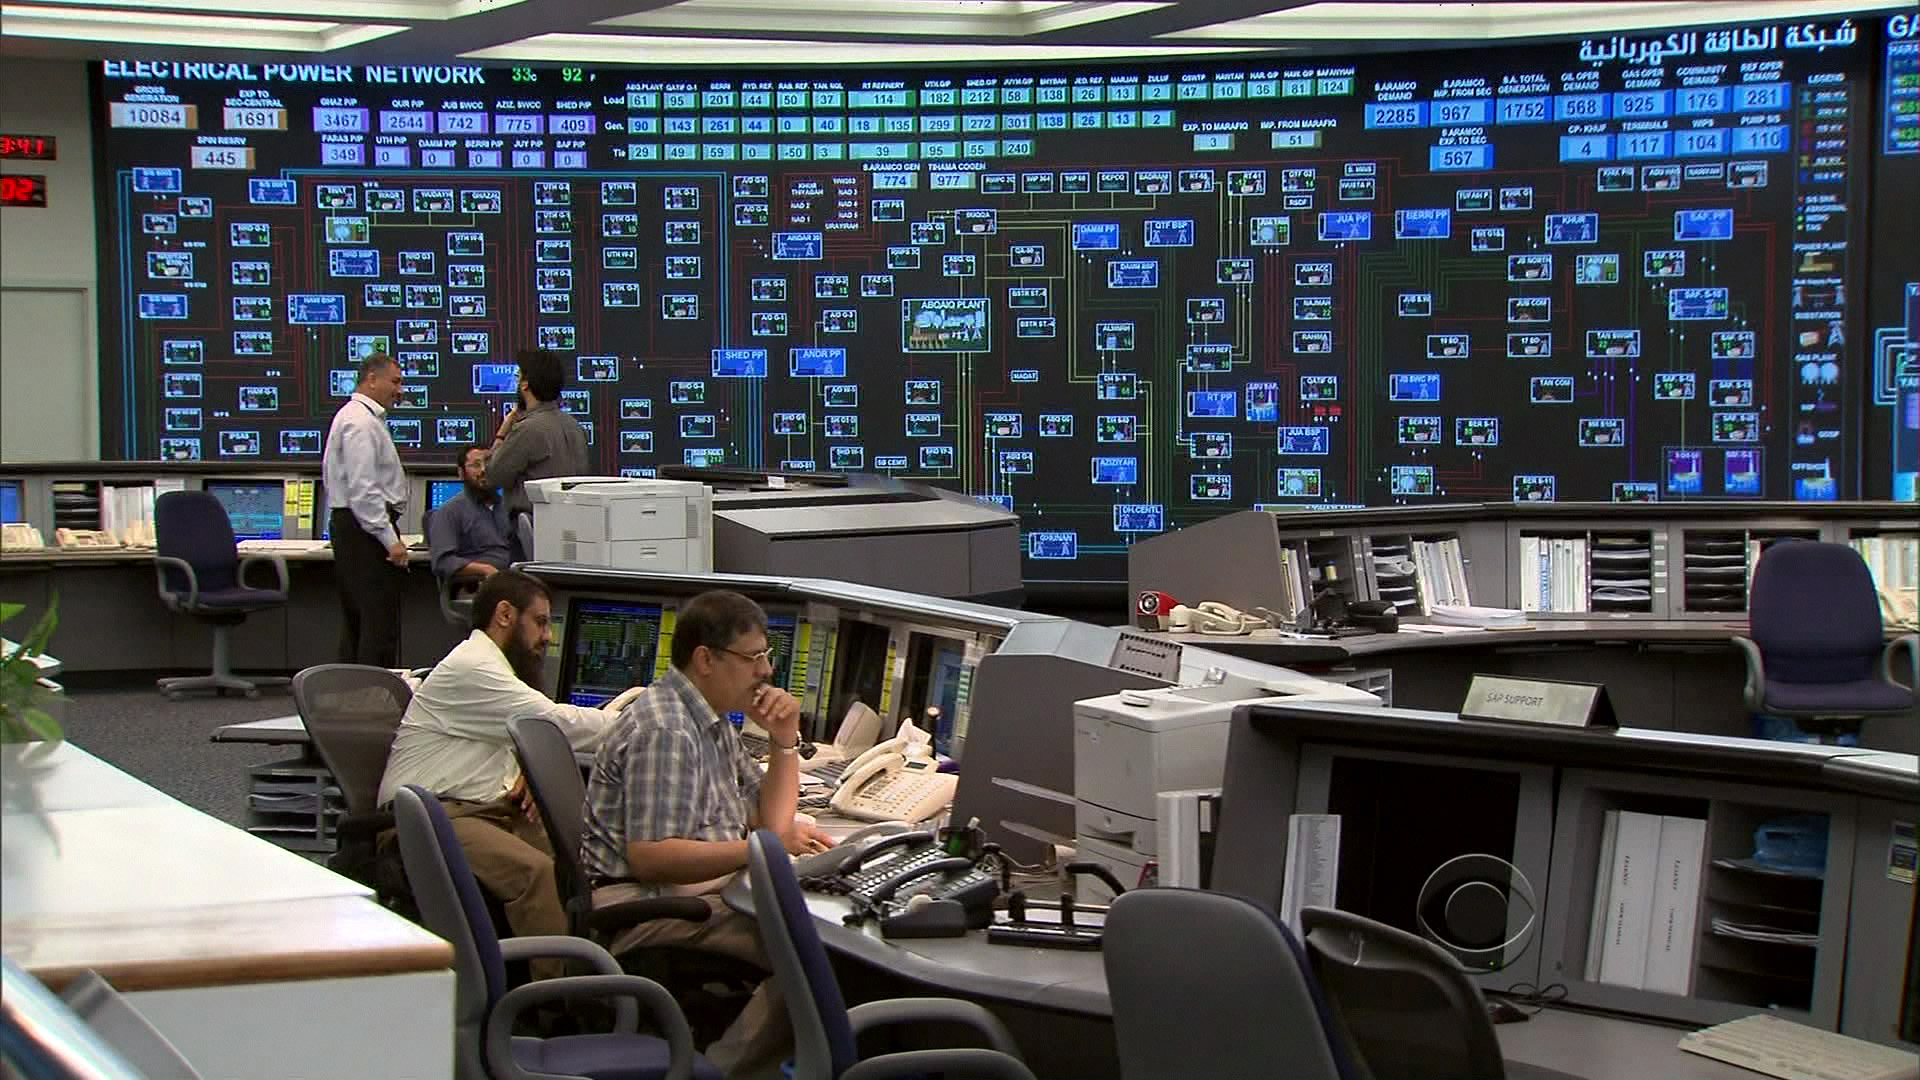
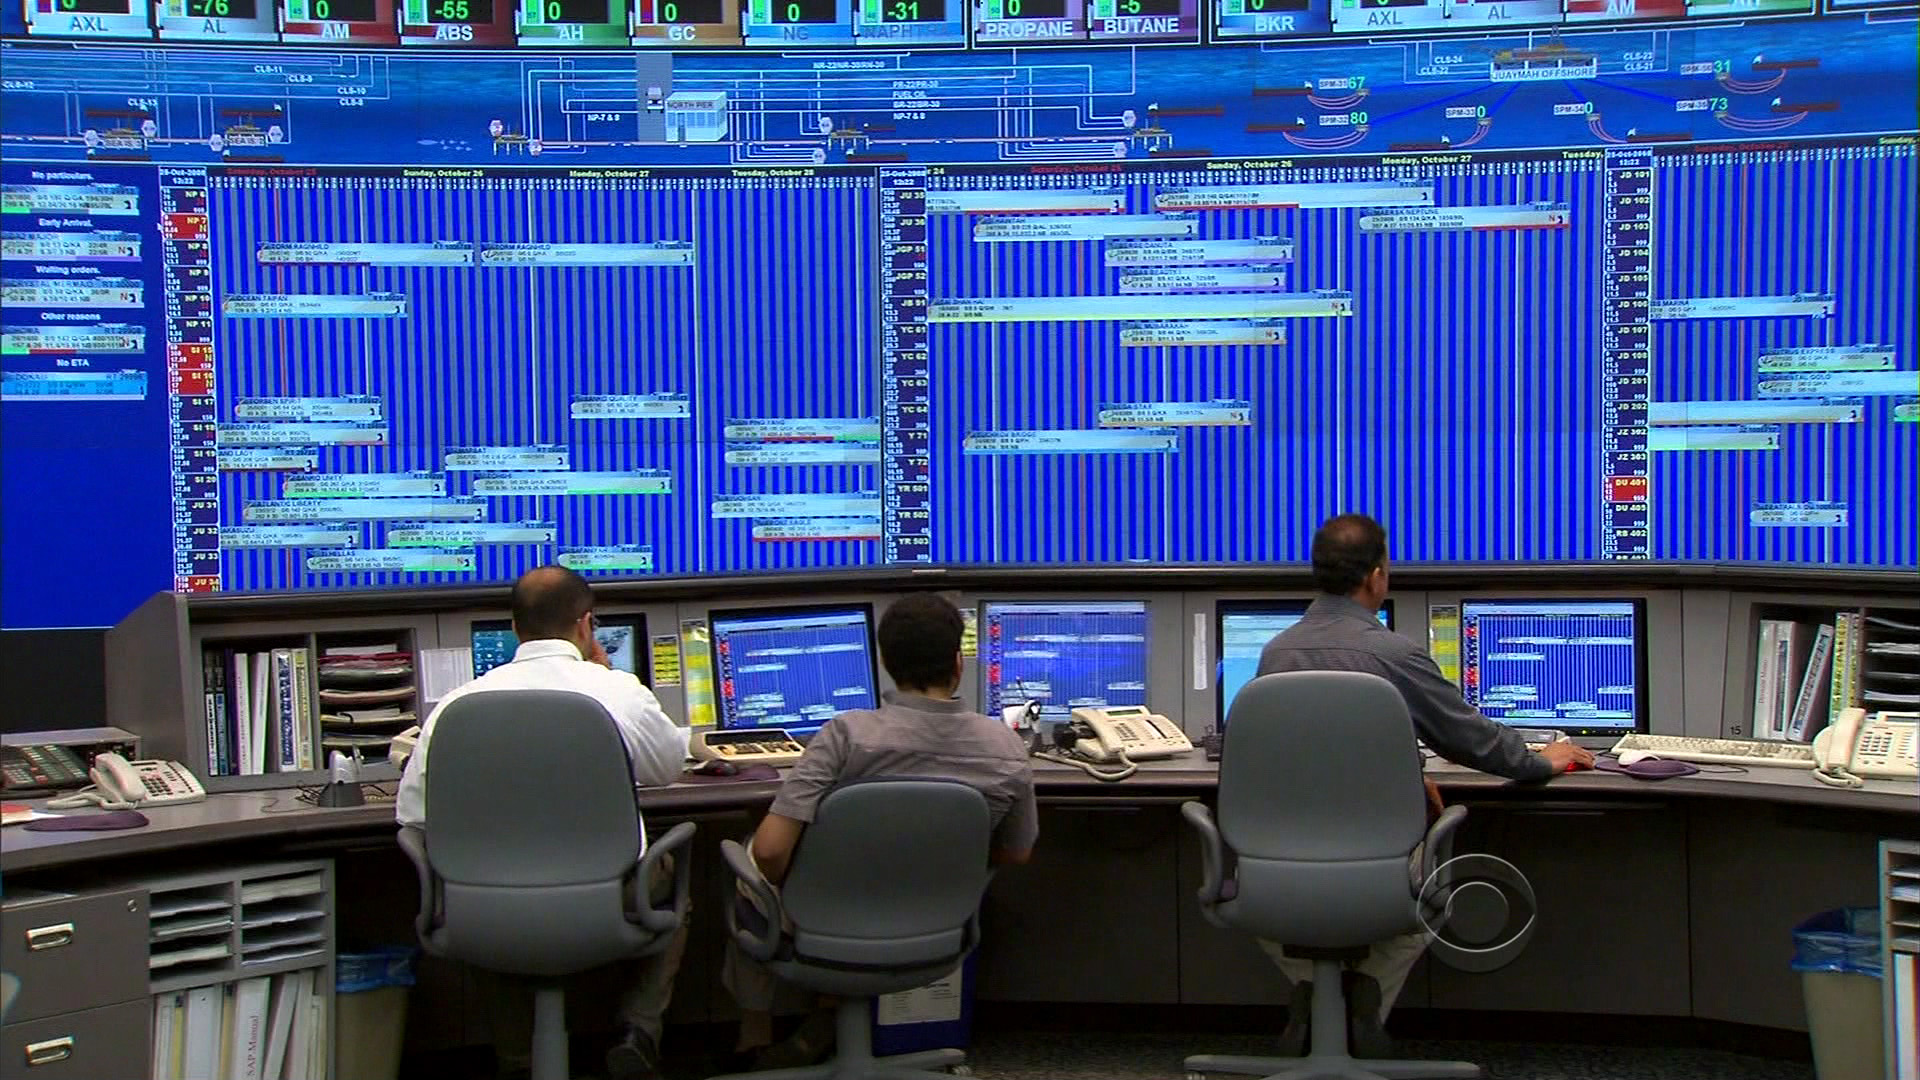
A large map shows all the oil fields in Saudi Arabia, including Ghawar, the largest on-shore oil field in the world, and Safaniya, the largest off-shore oil field in the world; green squares on the map monitor supertankers on the high seas in real time.
Here’s a short part of the segment that shows the display:
Since the smaller video doesn’t do it justice, several still images follow, each linked to their Comcastic, artifact-ridden HD versions:
Did rooms like this first exist in the movies and compelled everyone to imitate?
New guys and interns have to sit in front of the wall of vibrating bright blues:
The display is ambient in the sense that nobody’s actually using the larger version to do real work (you can see relevant portions replicated on individuals’ monitors). It seems to serve as a means of knowing what everyone in the room is up to (or as a deterrent against firing up Solitaire — I’m looking at you Ahmad). But more importantly, it’s there for visitors, especially visitors with video cameras, and people who write about visualization and happened to catch a segment about their info palace since it immediately followed the Patriots-Seahawks game.
A detail of one of the displays bears this out — an overload of ALL CAPS SANS SERIF TYPE with the appropriately unattractive array reds and greens. This sort of thing always makes me curious about what such displays would look like if they were designed properly. Rather than blowing up low resolution monitors, what would it look like if it were designed for the actual space and viewing distance in which it’s used?
Featuring “38 projects and more than 730,000 records,” the Los Angeles Times now has a Data Desk feature, a collection of searchable data sets and information graphics from recent publications. It’s like reading the LA Times online but only paying attention to the data-oriented features. (Boring? Appealing? Your ideal newspaper? We database, you decide. Eww, don’t repeat that.) On first glance I thought (hoped) it would be more raw data, but even having all the items collected in one location suggests something interesting for how newspapers share (and perceive, internally) their carefully researched (an massaged) data that they collect on a regular basis.
The New York Times has a very nicely done election map this year. Amongst its four viewing options is a depiction of counties that voted more Democratic (blue) or Republican (red) in comparison to the 2004 presidential election:
The blue is to be expected, given that the size of the win for Obama, but the red pattern is quite striking.
Also note the shift for candidate home states, in Arizona with McCain on the ticket, and what appears to be the reverse result in parts of Massachusetts, with Kerry no longer on the ticket. (The shift to the Democrats in Indiana is also amazing: without looking at the map closely enough I had assumed that area to be Obama’s home of Illinois.)
I recommend checking out the actual application on the Times site, the interaction lacks some of the annoying ticks that can be found in some of their other work (irritating rollovers that get in the way, worthless zooming, and silly transition animations). It’s useful and succinct, just like an infographic should be. Or just the way Mom used to make. Or whatever.
I apologize that I’ve been too busy and distracted with preparing Processing 1.0 to have any time to post things here, but here’s a quickie so that the page doesn’t just rot into total embarrassment.
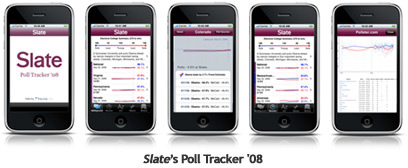
Slate this morning announced the availability of a poll tracking application for the iPhone:
I haven’t yet ponied up ninety nine of my hard-earned cents to buy it but find it oddly fascinating. Is there actually any interest for this? Is this a hack? Is there a market for such things? Is the market simply based on the novelty of it? Is it possible to quantify the size of the poll-obsessed political junkie market? And how is that market comprised—what percentage of those people are part of campaigns, versus just people who spend too much time reading political news? (I suspect the former is negligible, but may be tainted as a card-carrying member of the latter group.)
To answer my own questions, I suspect that it was thrown together by a couple of people from the tech side of the organization (meaning “hack” in the best sense of the word), who then sold management on it, with the rationale of 1) it’ll generate a little press (or hype on, um, blogs), 2) it’ll reinforce Slate readers’ interest in or connection to the site, and 3) it’s a little cool and trendy. I don’t think they’re actually planning to make money on it (or recoup any development costs), but that the price tag has more to do with 99¢ sounds more valuable and interesting than a free giveaway.
Of course, anyone with more interesting insights (let alone useful facts), please pass them along. I’m hoping it’s an actual Cocoa app, and not just a special link to web pages reformatted for the iPhone, which would largely invalidate this post and extinguish my own curiosity about the beast.
Update: The application is a branded reincarnation of a poll tracker developed by Aaron Brethorst at Chimp Software. Here’s his blog post announcing the change, and even a press release.
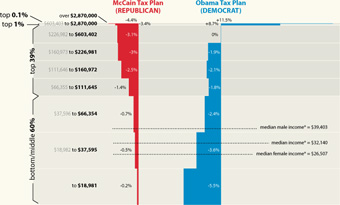
Just received a helpful note from Nelson Minar, who notes an already redrawn version of the graph from the last post over at Chartjunk. The redraw aims to improve the proportion between the different tax brackets:
Much better! Read more about their take, and associated caveats here. (Also thanks to Peter Merholz and Andrew Otwell who also wrote, yet were no match for Nelson’s swift fingers.)
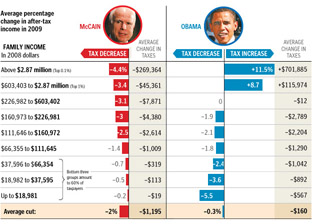
Finally, the infographic I’ve been waiting for, the Washington Post compares the tax proposals of United States presidential candidates John McCain and Barack Obama:
Lots of words have been spilled over the complexities of tax policy, whether in stump speeches, advertisements, or policy papers. But these are usually distilled for voters in lengthy articles that throw more words at the problem. But compare even a well-written article like this one at Business Week versus the graphic above from the Washington Post. Which of the two will you be able to remember tomorrow?
I also appreciate that the graphic very clearly represents the general tax policies of Republicans vs. Democrats, without showing bias toward either. The only thing that’s missing is a sense of how big each of the categories are – how many people are in the “over $2.87 million” category versus how many are in the “$66,000 to $112,000” category, which would help convey a better sense of the “middle class” term that candidates like to throw around.
There is still greater complexity to the debate than what’s shown in this image (the Business Week article describes treasury shortfalls based on the McCain proposal, for instance), but without the initial explanation provided by that graphic, will voters even bother with those details?
Someday I want to write like Ludacris, but for now I’ll enjoy info graphics of his work. Luda not only knows a lot of young ladies, but can proudly recite the range of area codes in which they live. Geographer (and feminist) Stefanie Gray took it upon herself to make a map:
You’ll need background music while taking a look; and I found a quick refresher of the lyrics also informative. More discussion and highlights of her findings can be found on Strange Maps, who first published Stefanie’s image.
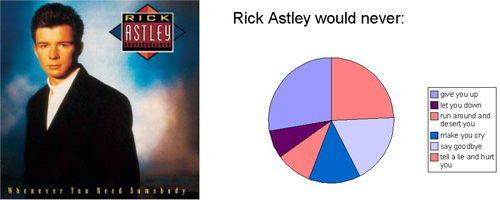
In related news, someone else has figured out Rick Astley:
I’ve added the album cover at left so that you can look into his eyes and see his honest face for yourself. If you’re not a proud survivor of the 80s (or perhaps if you are), the single can be had for a mere 99¢. Or if that only gets you started, you can pick up his Greatest Hits. Someone also made another version of the graphic using the Google chart API (mentioned earlier), though it appears less analytically sound (accurate).
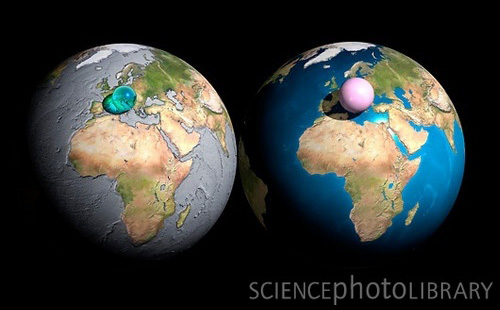
From a post by Dan Phiffer, an image by Adam Nieman and the Science Photo Library.
All the water in the world (1.4087 billion cubic kilometers of it) including sea water, ice, lakes, rivers, ground water, clouds, etc. Right: All the air in the atmosphere (5140 trillion tonnes of it) gathered into a ball at sea-level density. Shown on the same scale as the Earth.
More information at the original post. (Thanks to Eugene for the link.)
As much as snickering about computers in movies might make me feel smart, I’ve since become fascinated by how software, and in particular information, is portrayed in film. There are many layers at work:
Film is visual storytelling. As such, you have to be able to see everything that’s happening. Data is not visual, which is why you see symbols that represent data used more often: It’s 2012 but they’re still storing data on physical media because at some point, showing the data being moved is important. (Nevermind that it can be transmitted thousands of kilomteters in a fraction of a second.) This is less interesting, since it means a sort of dumbing-down of the technology, and presents odd contradictions. It can also make things ugly: progress bars are often full screen interface elements, or how many technology-heavy action flicks have included the pursuit of a computer disk? (On the other hand, the non-visual aspect can be a positive one: a friend finishing film school at NYU once pursued a nanotechnology thriller as his final film because “you can’t see it.” It would allow him to tackle a technical subject without needing the millions of dollars in props.)
Things need to “feel” like a computer. When this piece appeared in the Hulk, they added extra gray interface elements in and around it so that it didn’t look too futuristic. Nevermind that it was a real, working piece of software for browsing the human genome. To the consternation of a friend who worked on Minority Report, on-screen “windows” in the interface all had borders around them. If you have a completely fluid interface with hands, motion, and accessing piles of video being output from three people in a tank, do we really need…title bars?
It’s not just computers—anything remotely complicated is handled in this manner. Science may be worse off than software, though I don’t think scientists complain as loudly as the geeks did when they heard “This is UNIX, I know this!” (My personal favorite in that one was a scene where a video phone discussion was actually an actor talking to a QuickTime movie—you could see the progress bar moving left to right as the scene wore on.)
There’s a lot of superfluous gimmickery that goes on too. There’s just no way you’re gonna show important information in a film without random numbers twitching or counting down. Everything is more important when we have know the current time with millisecond accuracy (that’s three digits after the decimal point for seconds). Or maybe some random software code (since that’s incomprehensible but seems significant). This is obvious and sometimes painful to watch, except in the case of a talented visual designer who makes it look compelling.
Finally, the way that computers are represented in film has something to do with how we (society? lay people? them?) think that computers should work.
It’s that last one that is the fascinating point for me: by virtue of the intent to reach a large audience, a movie streamlines the way that information is handled and interfaces behave. A their best, it suggests where we need to go (at their worst, they blink “Access Denied”). It’s easy to point out the ridiculousness of the room full of people hunched over computers at CIA headquarters and the guy saying “give me all people with last name Jones in the Baltimore area” and in the next scene that’s tallied against satellite video (which of course can be enhanced ad infinitum). But think about how ridiculous those scenes looked twenty years ago, and the parts of that scenario that are no longer far-fetched as the population at large gets used to Google and having satellite imagery available for the price of typing a query. Even the most outrageous—the imagery enhancement—has had breakthroughs associated with it, some of which can be done by anyone using Photoshop, like the case of people trying to figure out if Bush was wearing a wire at the debates in 2004. (Contradicting their earlier denials, Bush’s people later admitted that he was wearing a bulletproof vest.)
That’s the end of today’s lecture on movie graphics, so I’ll leave you with a link to Mark Coleran, a visual designer who has produced many such sequences for film.
I recommend the large version of his demo reel, and I’ll be returning to this topic later with more designers. Drop me an email if you have favorite designer or film sequence.
As the .com shakeout loomed in the late 90s, I always assumed that:
Most internet-born companies would disappear.
Traditional (brick & mortar) stores would eventually get their act together and have (or outsource) a proper online presence. For instance Barnes & Noble hobbling toward a usable site, and Borders just giving up and turning over their online presence to Amazon. The former comical, the latter brilliant, though Borders has just returned with their own non-Amazonian presence. (Though I think the humor is now gone from watching old-school companies trying to move online.)
Finally, a few new names—namely the biggest ones, like Amazon—would be left that didn’t disappear with the others from point #1.
Basically, that not much would change. A couple new brands would emerge, but that there wasn’t really room in people’s heads for that many new retailers or services. (It probably didn’t help that all their logos were blue and orange, and had names like Flooz, Boo and Kibu that feel natural on the tongue and inspire buyer loyalty and confidence.)
But not only did more companies stick around, some seem to be successfully pivoting into other areas. From Amazon:
In January of 2008 we announced that the Amazon Web Services now consume more bandwidth than do the entire global network of Amazon.com retail sites.
This from a blog post with this plot of the bandwidth use for both sides of the business.
Did you imagine that the site where you could buy books cheaper than anywhere else in 1998 would ten years later exceed the bandwidth from that with services for data storage and cloud computing? Of course, this announcement doesn’t say anything about their profits at this point, but I don’t think anyone expected Steve Jobs to turn Apple into a toy factory and start turning out music players and cell phones to have it become half their business within just a few years. (That’s half as in, “beastly silver PCs and shiny black and white laptops seem important and all, but those take real work…why bother?”)
But the point (aside from subjecting you to a long-winded description of .com history and my shortcomings as a futurist) has more to do with Amazon becoming a business that’s dealing purely in information. The information economy is all about people moving bits and ideas around (abstractions of things), instead of silk, furs, and spices (actual physical things). And while books are information, the growth of Amazon’s data services business—as evidenced by that graph—is one of the strongest indicators I’ve seen of just how real the non-real information economy has become. Not that the information economy is something new; but that the groundwork has been laid in the preceding decades where something like Amazon Web Services can be successful.
And since we’re on the subject of Amazon, I’ll close with more from Jeff Bezos from “How the Web Was Won” in this month’s Vanity Fair:
When we launched, we launched with over a million titles. There were countless snags. One of my friends figured out that you could order a negative quantity of books. And we would credit your credit card and then, I guess, wait for you to deliver the books to us. We fixed that one very quickly.
Or showing his genius early on:
When we started out, we were packing on our hands and knees on these cement floors. One of the software engineers that I was packing next to was saying, You know, this is really killing my knees and my back. And I said to this person, I just had a great idea. We should get kneepads. And he looked at me like I was from Mars. And he said, Jeff, we should get packing tables.
Just received this in a message from a journalism grad student studying information graphics:
I have looked at 2 years worth of Glamour (and Harper’s Bazaar too) magazines for my project and it shows that Glamour and other women’s magazines have less amount of information graphics in the magazines compared to men’s magazines, such as GQ and Esquire. Why do you think that is? Do you think that is gender-related at all?
I hadn’t really thought about it much. For the record, my reply:
My fiancée (who knows a lot more about being female than I do) pointed out that such magazines have much less practical content in general, so it may have more to do with that than a specific gender thing. Though she also pointed out that, for instance, in today’s news about the earthquake in China, she felt that women might be more inclined to read a story with the faces of those affected than one with information graphics tallying or describing the same.
I think you’d need to find something closer to a male equivalent of Glamour so that you can cover your question and remove the significant bias you’re getting for the content. Though, uh, a male equivalent of Glamour may not really exist… But perhaps there are better options.
And as I was writing this, she responded:
Finding a male equivalent of Glamour is hard but they actually do have some hard-hitting stories near the back in every issue that sometimes might be overshadowed by all the fashion and beauty stuff. Actually, finding a female equivalent of GQ or Esquire is also hard because they sort of have a niche of their own too. I have to agree with your fiancée too, because, I studied Oprah’s magazines a little in my previous study and sometimes it is really about what appeals to their audience.
Well, my study does not imply causality and it sometimes might be hard to differentiate if the result was due to gender differences or content. So, it’s interesting to find all these out, and actually men’s magazines have about 5 times more information graphics than women’s magazines which is amazing.
Wow—five times more. (At least amongst the magazines that she mentioned.)
My hope in posting this (rather than just sharing the contents of my inbox…can you tell that I’m answering mail today?) is that someone else out there knows more about the subject. Please drop me a line if you do; I’d like to know more and to post a follow-up.
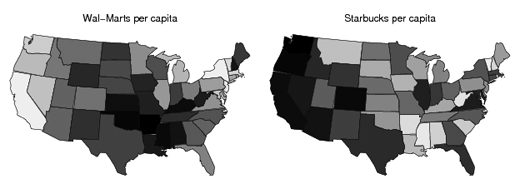
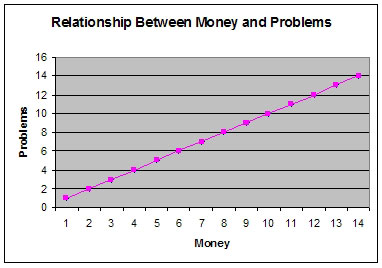
Given the number of data points provided, it would be difficult to refute the findings depicted in this chart.
Related work can be found here and here. While later research findings (by latecomers who foolishly claim to have invented the approach) here and here.
Beautiful info graphic from a September 2007 article about the restoration of the Guggenheim, depicting the cracks in the concrete walls. From the image:
Since the Guggenheim Museum opened in 1959, Frank Lloyd Wright’s massive spiral facade has been showing signs of cracking, mainly from seasonal temperature fluctuations that caus the concrete walls, built without expansion joints, to contract and expand.
The image is partly striking for the contrast between the NYT-style geometric graphic and pale colors mixed with the organic shape of the cracks. Wonderful.
Sent from one of my former students at CMU (you know who you are, drop me a line if it was you…I’ve lost the original message!)
Visualizing Data is my 2007 book about computational information design. It covers the path from raw data to how we understand it, detailing how to begin with a set of numbers and produce images or software that lets you view and interact with information. When first published, it was the only book(s) for people who wanted to learn how to actually build a data visualization in code.
The text was published by O’Reilly in December 2007 and can be found at Amazon and elsewhere. Amazon also has an edition for the Kindle, for people who aren’t into the dead tree thing. (Proceeds from Amazon links found on this page are used to pay my web hosting bill.)
The book covers ideas found in my Ph.D. dissertation, which is the basis for Chapter 1. The next chapter is an extremely brief introduction to Processing, which is used for the examples. Next is (chapter 3) is a simple mapping project to place data points on a map of the United States. Of course, the idea is not that lots of people want to visualize data for each of 50 states. Instead, it’s a jumping off point for learning how to lay out data spatially.
The chapters that follow cover six more projects, such as salary vs. performance (Chapter 5), zipdecode (Chapter 6), followed by more advanced topics dealing with trees, treemaps, hierarchies, and recursion (Chapter 7), plus graphs and networks (Chapter 8).
This site is used for follow-up code and writing about related topics.


 Featuring “38 projects and more than 730,000 records,” the Los Angeles Times now has a
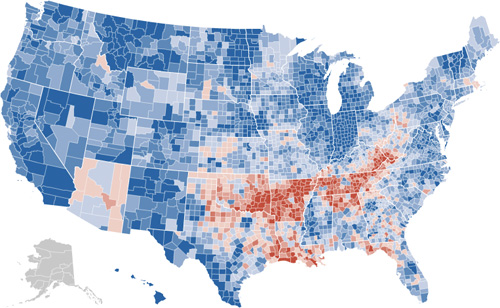


 Given the number of data points provided, it would be difficult to refute the findings depicted in this chart.
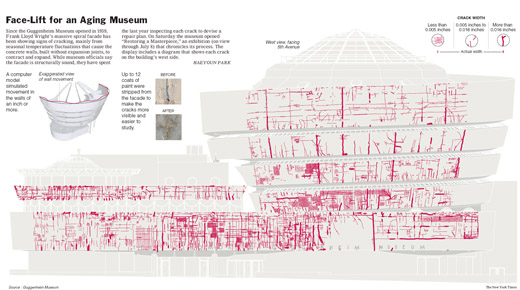
