 “Mapping Iran’s Online Public” is a fascinating (and very readable) paper from a study by John Kelly and Bruce Etling at Harvard’s Berkman Center. From the abstract:
In contrast to the conventional wisdom that Iranian bloggers are mainly young democrats critical of the regime, we found a wide range of opinions representing religious conservative points of view as well as secular and reform-minded ones, and topics ranging from politics and human rights to poetry, religion, and pop culture. Our research indicates that the Persian blogosphere is indeed a large discussion space of approximately 60,000 routinely updated blogs featuring a rich and varied mix of bloggers.
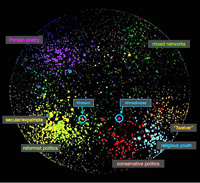
In addition to identifying four major poles (Secular/Reformist, Conservative/Religious, Persian Poetry and Literature, and Mixed Networks.) A number of surprising findings include details like the nature of discourse (such as the prominence of the poetry and literature category) or issues of anonymity:
…a minority of bloggers in the secular/reformist pole appear to blog anonymously, even in the more politically-oriented part of it; instead, it is more common for bloggers in the religious/conservative pole to blog anonymously. Blocking of blogs by the government is less pervasive than we had assumed.
They also produced images to represent the nature of the networks, seen in the thumbnail at right. The visualization is created with a force-directed layout that iteratively groups data points closer based on their content. It’s useful for this kind of study, where the intent is to represent or identify larger groups. In this case, the graphic supports what’s laid out in the text, but to me the most interesting thing about the study is the human-centered tasks of the project, such as the work done by hand in reviewing and categorizing such a large number of sites. It’s this background work that sets it apart from many other images like it which tend to rely too heavily on automation.
(The paper is from April 6, 2008 and I first heard about after being contacted by John in June. Around 1999, our group had hosted students that he was teaching in a summer session for a visit to the Media Lab. And now a few months later, I’m digging through my writing todo pile.)

