New work! Sometime collaborator and savior of this site Eugene Kuo and I have developed a piece for the PARSE show opening tomorrow (Friday, March 27) at the Axiom Art Gallery in Boston. From the announcement:
Curated by AXIOM Founding Director, Heidi Kayser, PARSE, includes the work of five artists who use data to present new perspectives on the underlying information that makes us human. Overlooked patterns of data surround us daily. The artists in PARSE sort, separate and amalgamate physical, mental and social information to create intricate visualizations in print, interactive media, animation and sculpture. These pieces track and reflect our brainwaves during REM sleep, our genetic code, our social icons, and even our carnal desires.
 Featuring works by: Ben Fry and Eugene Kuo, Fernanda Viegas and Martin Wattenberg, Jason Salavon, Jen Hall
The opening is from 6-9pm. The gallery location is amazing — it’s a nook to the side of the Green Street subway station (on the Orange Line in Boston) — it makes me think of what it might be like to have a show at the lair of Bill Murray’s character in Caddyshack. I love that it’s been reserved as a gallery space.
Martin & Fernanda are showing their Fleshmap project, along with a pair of amalgamations by Jason Salavon, and two sculptures from Jen Hall (hrm, can’t find a link for those). Our project is described here, and uses comparisons of the DNA between many species that have been the focus of my curiosity recently to make compositions like the one seen to the right.
Update: As of January 1st, 2010, I’m no longer at Seed. Read more here.
Some eighteen months as visualization vagabond (roving writer, effusive explainer, help me out here…) came to a close in December when I signed up with Seed Media Group to direct a new visualization studio here in Cambridge. We now have a name—the Phyllotaxis Lab—and as of last week, we’ve made it official with a press release:
NEW YORK and CAMBRIDGE, MA (March 5, 2009) – Building on Seed Media Group’s strong design culture, Adam Bly, founder and CEO, announced today the appointment of Ben Fry as the company’s first Design Director. Seed Media Group also announced the launch of a new unit focused on data and information visualization to be based in Cambridge, Massachusetts and headed by Ben Fry.
Seed Visualization will help companies and governments find solutions to clearly communicate complex data sets and information to various stakeholders.  The unit’s research arm, the Phyllotaxis Lab, will work to advance the field of data visualization and will undertake research and experimental design work. The Lab will partner with academic institutions around the world and will provide education on the field of data visualization.
And about that name:
Phyllotaxis is a form commonly found in nature that is derived from the Fibonacci sequence. It is the inspiration for Seed Media Group’s logo, designed in 2005 by Stefan Sagmeister and recently included in the Design and the Elastic Mind exhibit at MoMA. “Much like a phyllotaxis, visualization is about both numbers and information as well as structure and form,” said Ben Fry. “It’s a reminder that beauty is derived from the intelligence of the solution.”
The full press release can be found here (PDF), and more details are forthcoming.
This is gonna be great.
Alice Rawsthorn writes about visualization in today’s International Herald Tribune, which also includes a mention of Processing:
Producing visualization required the development of new tools capable of analyzing huge quantities of complex data, and interpreting it visually. In the forefront is Processing, a software system devised by the American designers, Ben Fry and Casey Reas, to enable computer programmers to create visual images, and designers to get to grips with programming. “Processing is a bridge between those fields,” said Reas. “Designers feel comfortable with it because it enables them to work visually, yet it also feels familiar to programmers.”
Paola Antonelli on visualization:
“Visualization is not simply an evolution of graphic design, but a complete and complex design form that requires spatial, narrative, synthetic and graphic sensitivity and expertise,” explained Antonelli. “That’s why we see so many practitioners – architects, product designers, filmmakers, statisticians and graphic designers – flocking to it.”
The Humans vs. Chimps illustration even gets a mention:
Take a scientific question like the genetic difference between humans and chimpanzees. Would you prefer to plough through an essay on the subject, or to glance at the visualization created by Fry in which the 75,000 letters of coding in the human genome form a photographic image of a chimp’s head? Virtually all of our genetic information is identical, and Fry highlights the discrepancies by depicting nine of the letters as red dots. No contest again.
The full article is here, and also includes a slide show of other works.
The O’Reilly press folks passed along this review (PDF) of Visualizing Data from USENIX magazine. I really appreciated this part:
My favorite thing about Visualizing Data is that it tackles the whole process in all its blood, guts, and gore. It starts with finding the data and cleaning it up. Many books assume that the data fairy is going to come bring you data, and that it will either be clean, lovely data or you will parse it carefully into clean, lovely data. This book assumes that a significant portion of the data you care about comes from some scuzzy Web page you don’t control and that you are going to use exactly the minimum required finesse to tear out the parts you care about. It talks about how to do this, and how to decide what the minimum required finesse would be. (Do you do it by hand? Use a regular expression? Actually bother to parse XML?)
Indeed, writing this book was therapy for that traumatized inner child who learned at such a tender young age that the data fairy did not exist.
This is from May, and the Design and the Elastic Mind show has now finished, but Paola Antonelli’s interview with Charlie Rose is well worth watching.
Paola’s incredibly sharp. Don’t turn it off in the first few minutes, however; I found that it wasn’t until about five or even ten minutes into the show that she began to sound like herself. I guess it takes a while to get past the requisite television pleasantries and the basic design-isms.
The full transcript doesn’t seem to be available freely, however some excerpts:
And I believe that design is one of the highest forms of human creative expression.
I would never dare say that! But I’ll secretly root for her making her case.
And also, I believe that designers, when they’re good, take revolutions in science and in technology, and they transform them into objects that people like us can use.
Doesn’t that make you want to be a designer when you grow up?
Regarding the name of the show, and the notion of elasticity:
…it was about showing how we need to adapt to different conditions every single day. Just work across different time zones, go fast and slow, use different means of communication, look at things at different scales. You know, some of us are perfectly elastic. And instead, some others get a little bit of stretch marks. And some others just cannot deal with it.
And designers help us cope with all these changes.
Her ability to speak plainly and clearly reinforces her point about designers and their role in society. (And if you don’t agree, consider what sort of garbage she could have said, or rather that most would have said, speaking about such a trendy oh-so-futuristic show.)
In the interest of full disclosure, she does mention my work (very briefly), but that’s not until about halfway through, so it shouldn’t interfere with your enjoyment of the rest of the interview.
Perhaps three months late for an announcement, and at the risk of totally reckless narcissism, I should mention that four of my projects are currently on display in the Design and the Elastic Mind exhibition at the Museum of Modern Art in New York. My work notwithstanding, I hear that the show is generating lots of foot traffic and positive reviews, which is a well-deserved compliment to curator Paola Antonelli.
There’s a New York Times article and slide show (too much linking to the Times lately, weird…) and a writeup in the International Herald Tribune that even mentions my Humans vs. Chimps piece.
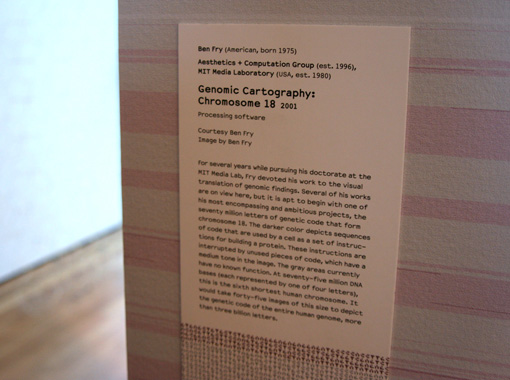
The first wall as you enter the show is all of Chromosome 18, done in the style of this piece.
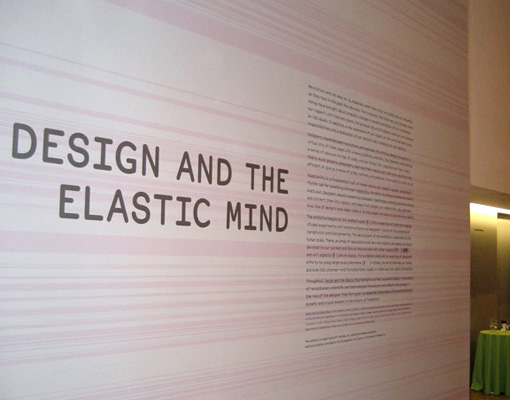
It’s a 3 pixel font at 150 dpi, so there are 37.5 letters per inch in either direction, and the wall is about 20 feet square, making 75 million letters total. Paola and her staff asked whether it was OK to put the text on the piece itself, which I felt was fine, as the nature of the piece is about scale, and the printing would not detract from that. The funny side effect of this was watching people at the opening take one another’s picture in front of the piece, mostly probably not realizing that the wall itself was part of the exhibition. Perhaps my most popular work so far, given the number of family photos in which it will be found.
Former classmate Ron Kurti also took a nice detail shot:
Also in the show is the previously mentioned Humans vs. Chimps project as seen below:
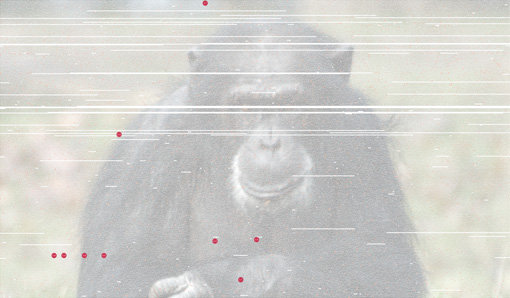
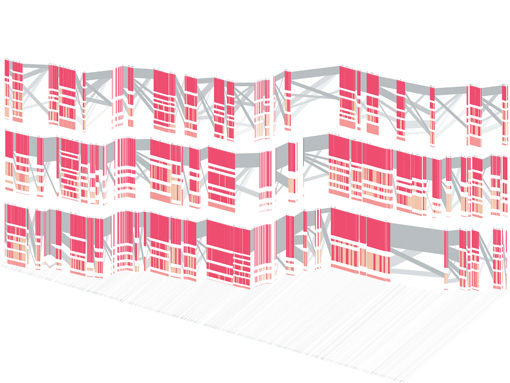
This image is about three feet wide so you can read the letters accurately. It’s found next to an identically sized print of isometricblocks depicting the CFTR region of the human genome (the area implicated in connection to Cystic Fibrosis). The image was first developed for a Nature cover.
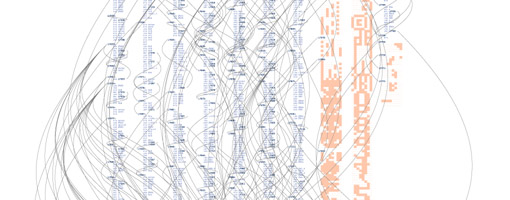
Finally, the Pac-Man print of distellamap is printed floor to ceiling on another wall in the exhibition. Unfortunately there was a glitch in the printing that caused the lines connecting portions of the code to be lost (because they’re too thin to see at a distance), but no matter.
Much moreso than my own work, however, by far the most exciting for me is the number of projects built with Processing that are in the show. It’s a bit humbling and the sort of thing that makes me excited (and relieved) to have some time this summer to devote to Processing itself.

